Full Report
The numbers behind PT Mastersystem Infotama Tbk: as-reported financial statements and company metrics for FY2021–FY2025, traced to the source filings, opened with the share-price history those statements have to justify. Every linked figure opens the exact page of the filing it was printed on, with the statement row highlighted. Amounts in Rp millions unless noted.
Reading notes: Figures are presented in millions of Indonesian Rupiah (Rp millions); the audited financial statements are stated in full Rupiah and every linked figure highlights the full-Rupiah amount on the source page. MSTI reports a single operating/reportable segment, so no segment table is disclosed; the revenue breakdown is the Net Sales note disaggregating revenue into Hardware, Software, Maintenance and Installation. FY2025, FY2024 and FY2023 figures are cited to the company's audited annual financial statements (Q4 filings). FY2022, FY2021 and FY2020 are cited to the audited financial statements reproduced in the 2023 IPO prospectus (which presents FY2020-FY2022). FY2020 appears only in the Long-Term Record; the main statement columns run FY2021-FY2025.
Share Price — Available History Since July 2025
The stock closed at IDR 1,350 on Jul 22, 2026 — down 11% over the window shown, trading between IDR 1,155 and IDR 1,675.
Source: market price feed, daily closes, Jul 2025–Jul 2026 — the feed marks this available history as partial. Price return only, excludes dividends.
FY2025 at a Glance
Revenue (Rp millions)
Operating income (Rp millions)
Net income (Rp millions)
Source: FY2025 consolidated statements [1] [2] [3] [4]. Click any linked figure to open the filing page with the row highlighted.
Net Sales by Category
| Net Sales by Category | FY2021 | FY2022 | FY2023 | FY2024 | FY2025 |
|---|---|---|---|---|---|
| Hardware | 1,894,736 | 2,126,846 | 2,374,247 | 3,153,501 | 2,711,067 |
| Software | 688,547 | 661,669 | 1,007,991 | 1,224,679 | 1,696,387 |
| Maintenance | 375,241 | 468,537 | 585,000 | 698,108 | 792,075 |
| Installation | 155,601 | 253,210 | 233,689 | 285,252 | 255,173 |
| Total net sales | 3,114,124 | 3,510,262 | 4,200,927 | 5,361,540 | 5,454,702 |
Source: Notes to the Financial Statements - Net Sales (single reportable segment; disaggregated by product/service category) [5] [6] [7] [8]. Click any linked figure to open the filing page with the row highlighted.
Income Statement
Source: Statement of Profit or Loss and Other Comprehensive Income [1] [2] [3] [4]. Click any linked figure to open the filing page with the row highlighted.
Columns marked E are consensus analyst estimates from S&P Capital IQ (CapIQ), shown alongside reported results for direct comparison; they are not company guidance.
Estimate source: S&P Capital IQ (CapIQ) consensus, as of 2026-07-22. Estimate figures are S&P Capital IQ consensus (vendor data — no filing page links). EPS and net income use the normalized (adjusted) consensus where the street reports it. Consensus revenue sits well below the as-reported line for the last actual year — analysts often model a narrower revenue basis (e.g. net of interest or pass-through costs), so compare trends, not levels.
Balance Sheet
Source: Statement of Financial Position [9] [10] [11] [12]. Click any linked figure to open the filing page with the row highlighted.
Cash Flow
| Cash Flow | FY2021 | FY2022 | FY2023 | FY2024 | FY2025 |
|---|---|---|---|---|---|
| Net cash provided by operating activities | 230,580 | 129,091 | 243,106 | 905,320 | 696,894 |
| Acquisitions of property and equipment | (2,416) | (37,044) | (29,884) | (30,768) | (31,121) |
| Net cash used in investing activities | 3,159 | (31,014) | (20,593) | (9,845) | (937) |
| Dividends paid | (400,000) | (165,000) | (350,000) | (313,380) | (420,682) |
| Net cash provided by (used in) financing activities | (393,625) | (309,949) | 349,014 | (471,138) | (478,660) |
| Net increase (decrease) in cash and cash equivalents | — | (211,872) | 571,526 | 424,337 | 217,297 |
| Free cash flow, derived | 228,164 | 92,047 | 213,222 | 874,552 | 665,773 |
Source: Statement of Cash Flows [13] [14] [15] [16]. Click any linked figure to open the filing page with the row highlighted.
Profitability Returns (as reported)
| Profitability Returns (as reported) | FY2021 | FY2022 | FY2023 | FY2024 | FY2025 |
|---|---|---|---|---|---|
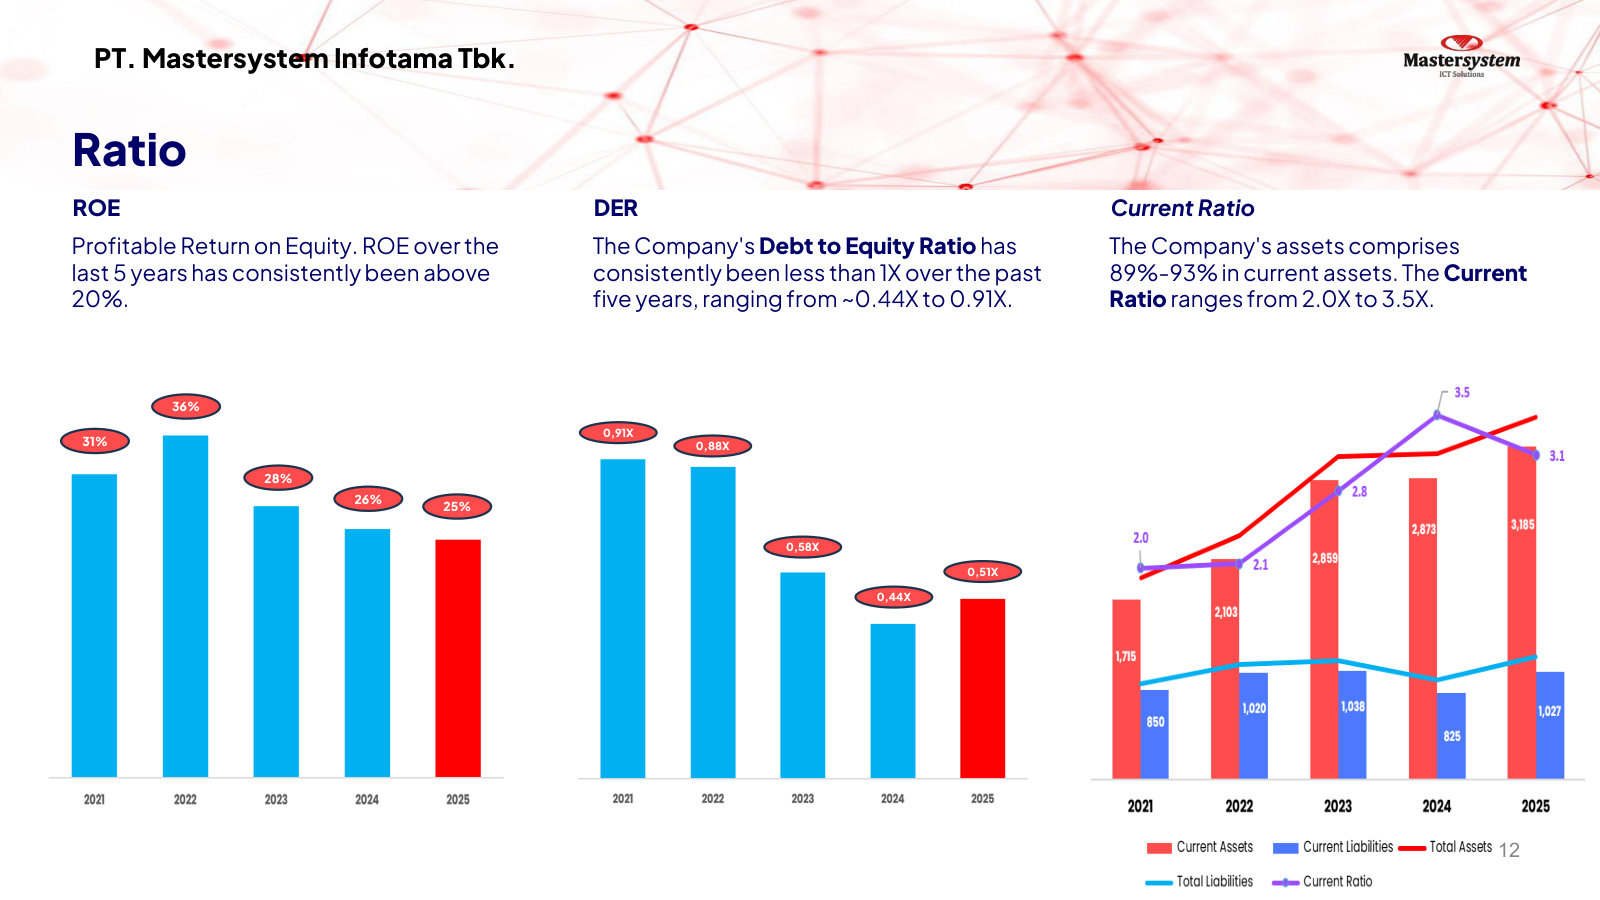
| Return on equity (profit to equity) | 32.45% | 32.24% | 23.02% | 24.54% | 23.96% |
| Return on assets (profit to assets) | 17.01% | 17.10% | 14.52% | 17.04% | 15.86% |
| Net profit margin (profit to net sales) | 10.50% | 11.37% | 10.66% | 9.89% | 10.07% |
Source: company filings [17] [18] [19]. Click any linked figure to open the filing page with the row highlighted.
Balance Sheet Strength Working Capital (as reported)
| Balance Sheet Strength Working Capital (as reported) | FY2021 | FY2022 | FY2023 | FY2024 | FY2025 |
|---|---|---|---|---|---|
| Current ratio (x) | 2.02 | 2.04 | 2.75 | 3.48 | 3.10 |
| Debt-to-equity (liabilities to equity, x) | 0.91 | 0.88 | 0.58 | 0.44 | 0.51 |
| Inventory turnover (x) | — | — | — | 6.42 | 7.89 |
| Receivables collection period (days) | — | — | — | 46.04 | 45.61 |
Source: company filings [20] [17] [18] [19]. Click any linked figure to open the filing page with the row highlighted.
Net Sales by Customer Segment
| Net Sales by Customer Segment | FY2021 | FY2022 | FY2023 | FY2024 | FY2025 |
|---|---|---|---|---|---|
| Financial services | — | — | 2,297,580 | 2,925,474 | 2,920,467 |
| Telecommunication | — | — | 1,047,572 | 1,401,244 | 1,079,561 |
| Public sector | — | — | 108,162 | 119,063 | 168,386 |
| Oil gas | — | — | 71,284 | 96,154 | 127,738 |
| Other sectors | — | — | 676,329 | 819,605 | 1,158,550 |
Source: company filings [21] [22]. Click any linked figure to open the filing page with the row highlighted.
Workforce Market Footprint
| Workforce Market Footprint | FY2021 | FY2022 | FY2023 | FY2024 | FY2025 |
|---|---|---|---|---|---|
| Total employees | 608 | 762 | 867 | 979 | 1,032 |
| Engineers | — | 415 | 497 | 567 | 611 |
| Contract employees | — | 204 | 254 | 342 | 390 |
| Customers served (entities, minimum) | — | — | — | — | 1,000 |
| IT principal partners (minimum) | — | — | — | — | 40 |
Source: company filings [23] [24] [25] [26]. Click any linked figure to open the filing page with the row highlighted.
Long-Term Record
| Fiscal year | Total net sales | Operating profit | Profit for the year | Basic earnings per share | Net cash provided by operating activities | Acquisitions of property and equipment |
|---|---|---|---|---|---|---|
| FY2020 | 2,897,471 | — | — | 117.00 | 350,696 | (19,227) |
| FY2021 | 3,114,124 | 424,432 | 326,928 | 123.00 | 230,580 | (2,416) |
| FY2022 | 3,510,262 | 539,105 | 398,942 | 150.00 | 129,091 | (37,044) |
| FY2023 | 4,200,927 | 582,055 | 447,726 | 163.02 | 243,106 | (29,884) |
| FY2024 | 5,361,540 | 645,701 | 530,374 | 168.97 | 905,320 | (30,768) |
| FY2025 | 5,454,702 | 664,070 | 549,081 | 174.90 | 696,894 | (31,121) |
Source: consolidated statements across filings; older years from the standardized feed [5] [14] [1] [6]. Click any linked figure to open the filing page with the row highlighted.
Analyst Consensus
Mean target
Median target
High target
Low target
Street ratings: 2 strong buy, 1 buy. Consensus: Strong Buy.
Estimate source: S&P Capital IQ (CapIQ) consensus, as of 2026-07-22. Estimate figures are S&P Capital IQ consensus (vendor data — no filing page links). EPS and net income use the normalized (adjusted) consensus where the street reports it. Consensus revenue sits well below the as-reported line for the last actual year — analysts often model a narrower revenue basis (e.g. net of interest or pass-through costs), so compare trends, not levels.
Traceability
292 of 292 figures on this page (100%) link to the filing page where they are printed — click a linked figure to open the source PDF at that page with the row highlighted. Unlinked figures come from standardized data feeds or pre-filing years.
Figures are presented in millions of Indonesian Rupiah (Rp millions); the audited financial statements are stated in full Rupiah and every linked figure highlights the full-Rupiah amount on the source page.
MSTI reports a single operating/reportable segment, so no segment table is disclosed; the revenue breakdown is the Net Sales note disaggregating revenue into Hardware, Software, Maintenance and Installation.
FY2025, FY2024 and FY2023 figures are cited to the company's audited annual financial statements (Q4 filings). FY2022, FY2021 and FY2020 are cited to the audited financial statements reproduced in the 2023 IPO prospectus (which presents FY2020-FY2022).
FY2020 appears only in the Long-Term Record; the main statement columns run FY2021-FY2025.
Basic EPS is split-adjusted for the 2:1 stock split completed at the 2023 IPO (par value Rp 50 - Rp 25). FY2023 EPS is cited to the FY2024 audited FS comparative column (Rp 163.02) for two-decimal precision.
FY2021 'Net increase (decrease) in cash' is left blank: the IPO prospectus cash-flow summary row did not parse cleanly; the FY2021 opening/closing cash balances are shown on the Balance Sheet.
3 figure(s) differed between the data feed and the filing; the filing value is shown (see the run's metrics/metrics_tab.json for the audit trail).
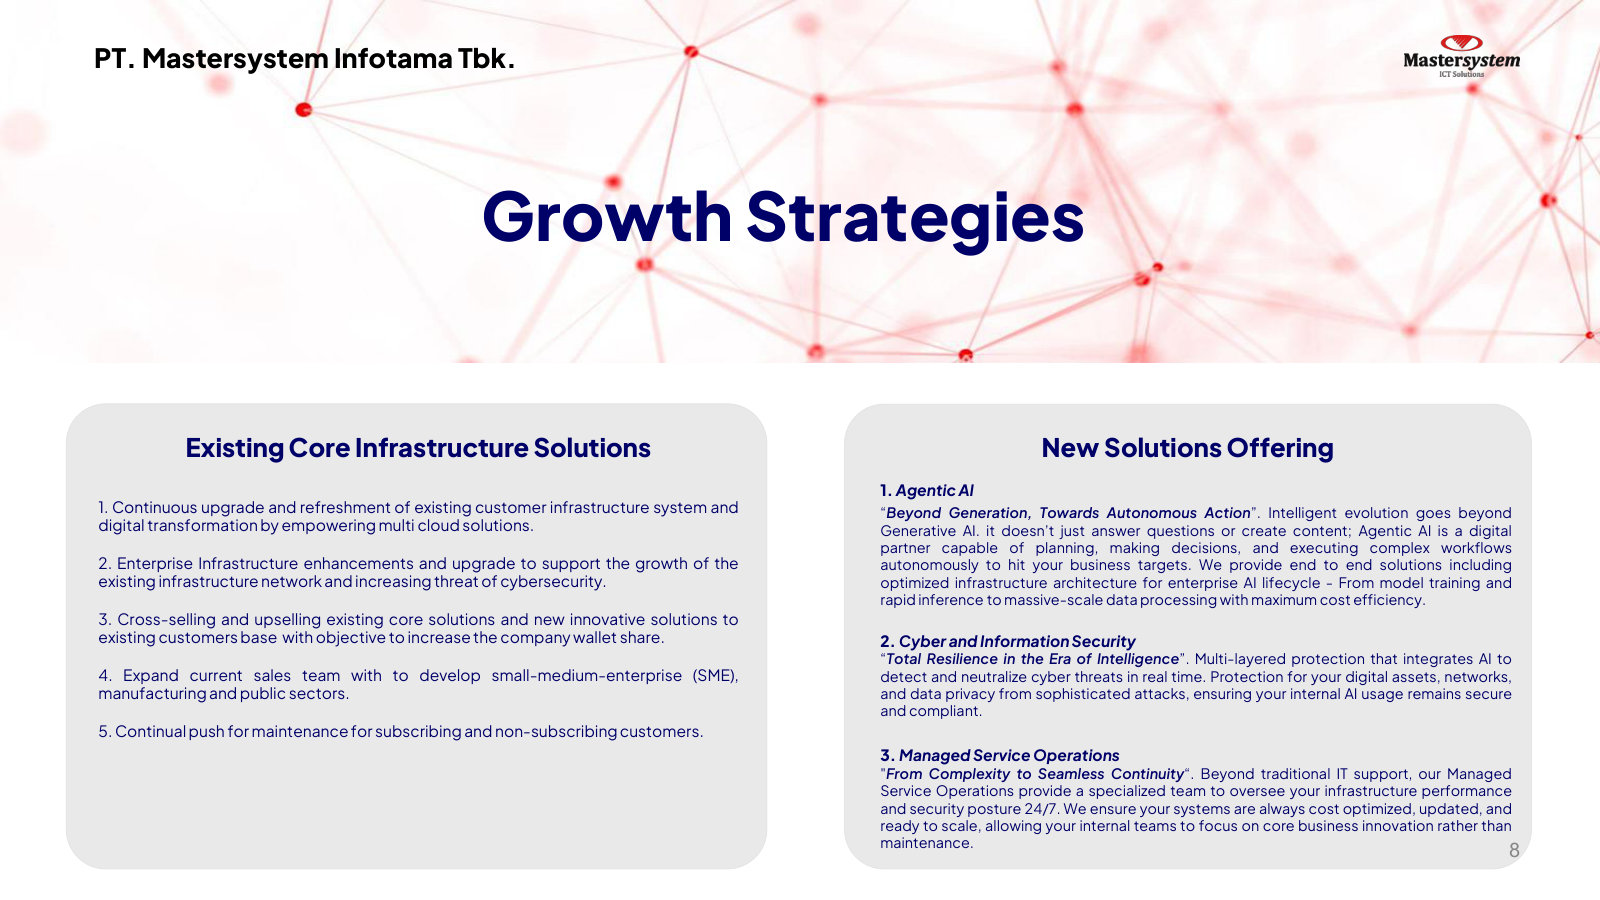
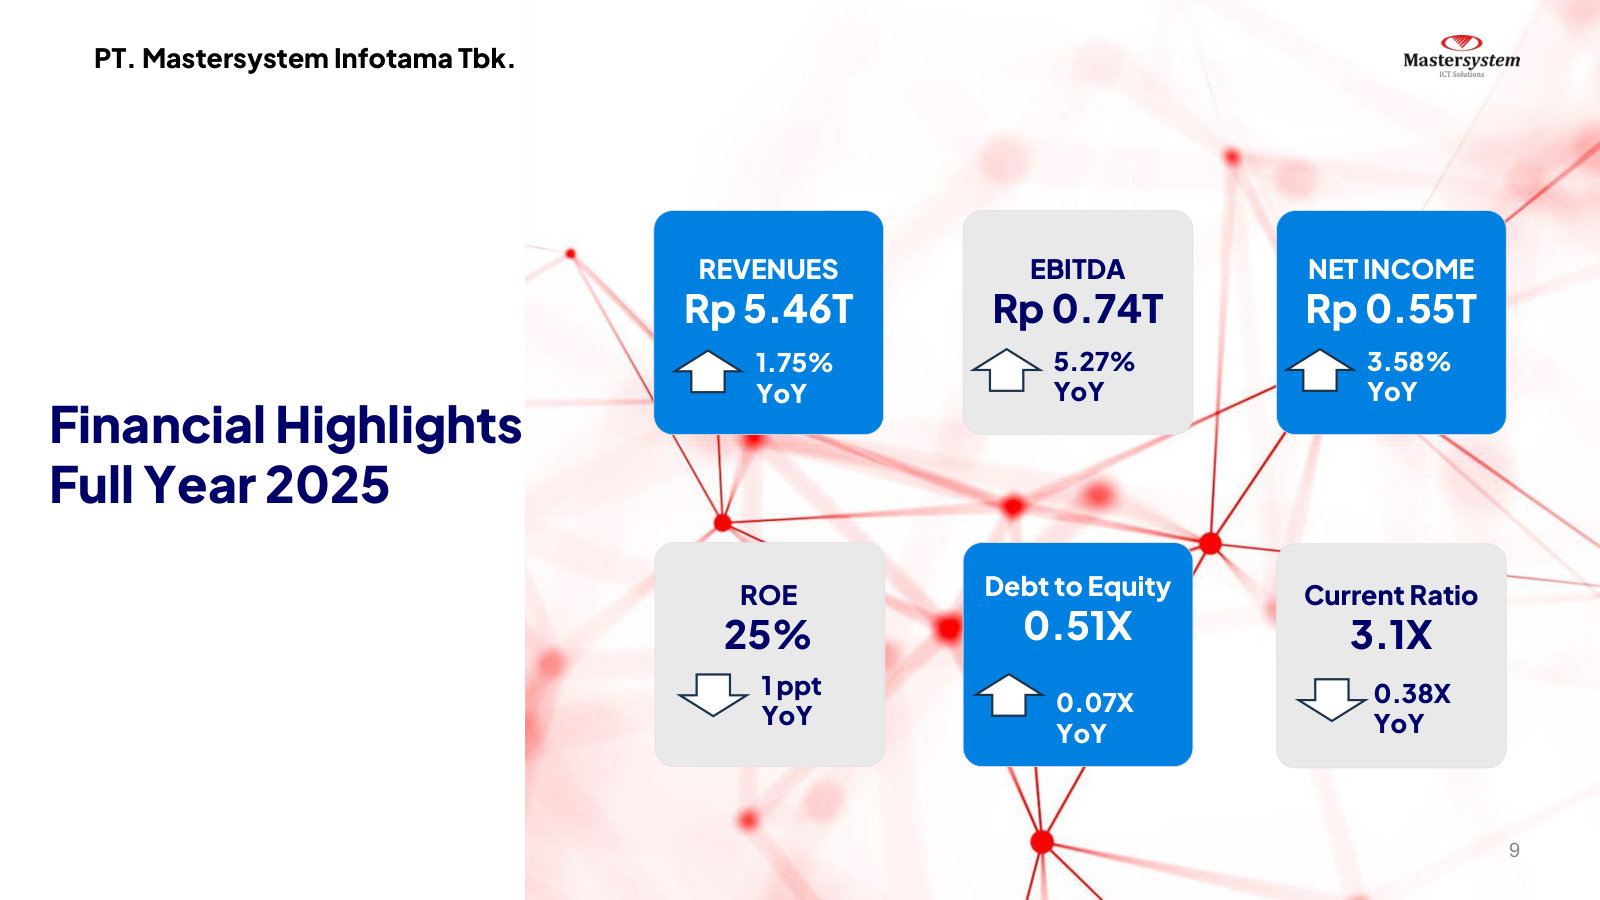
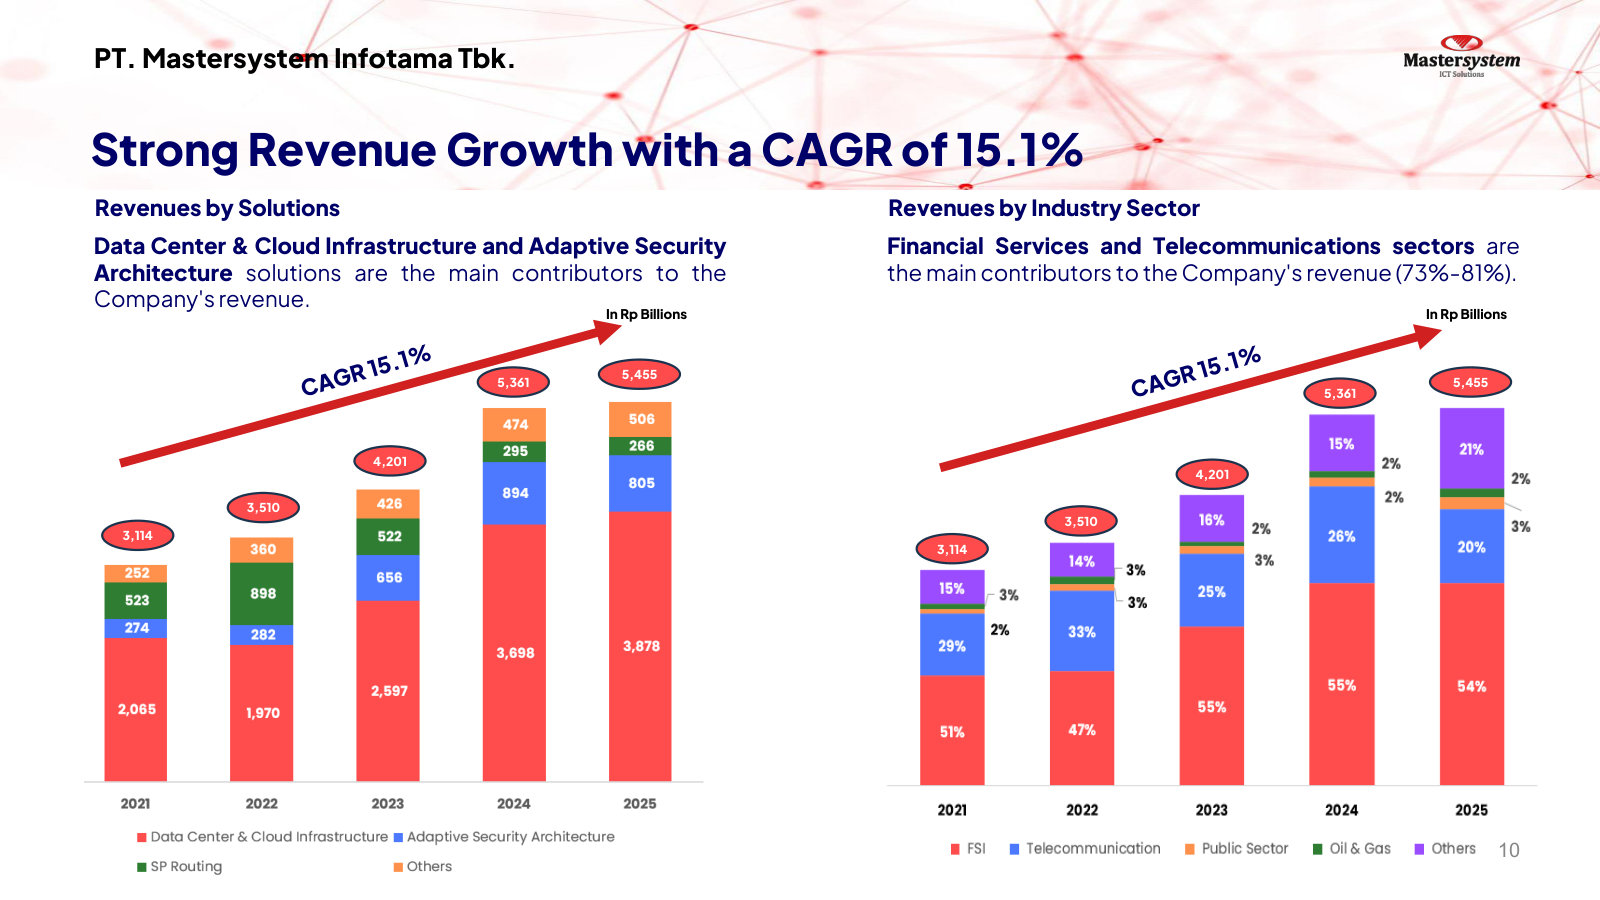
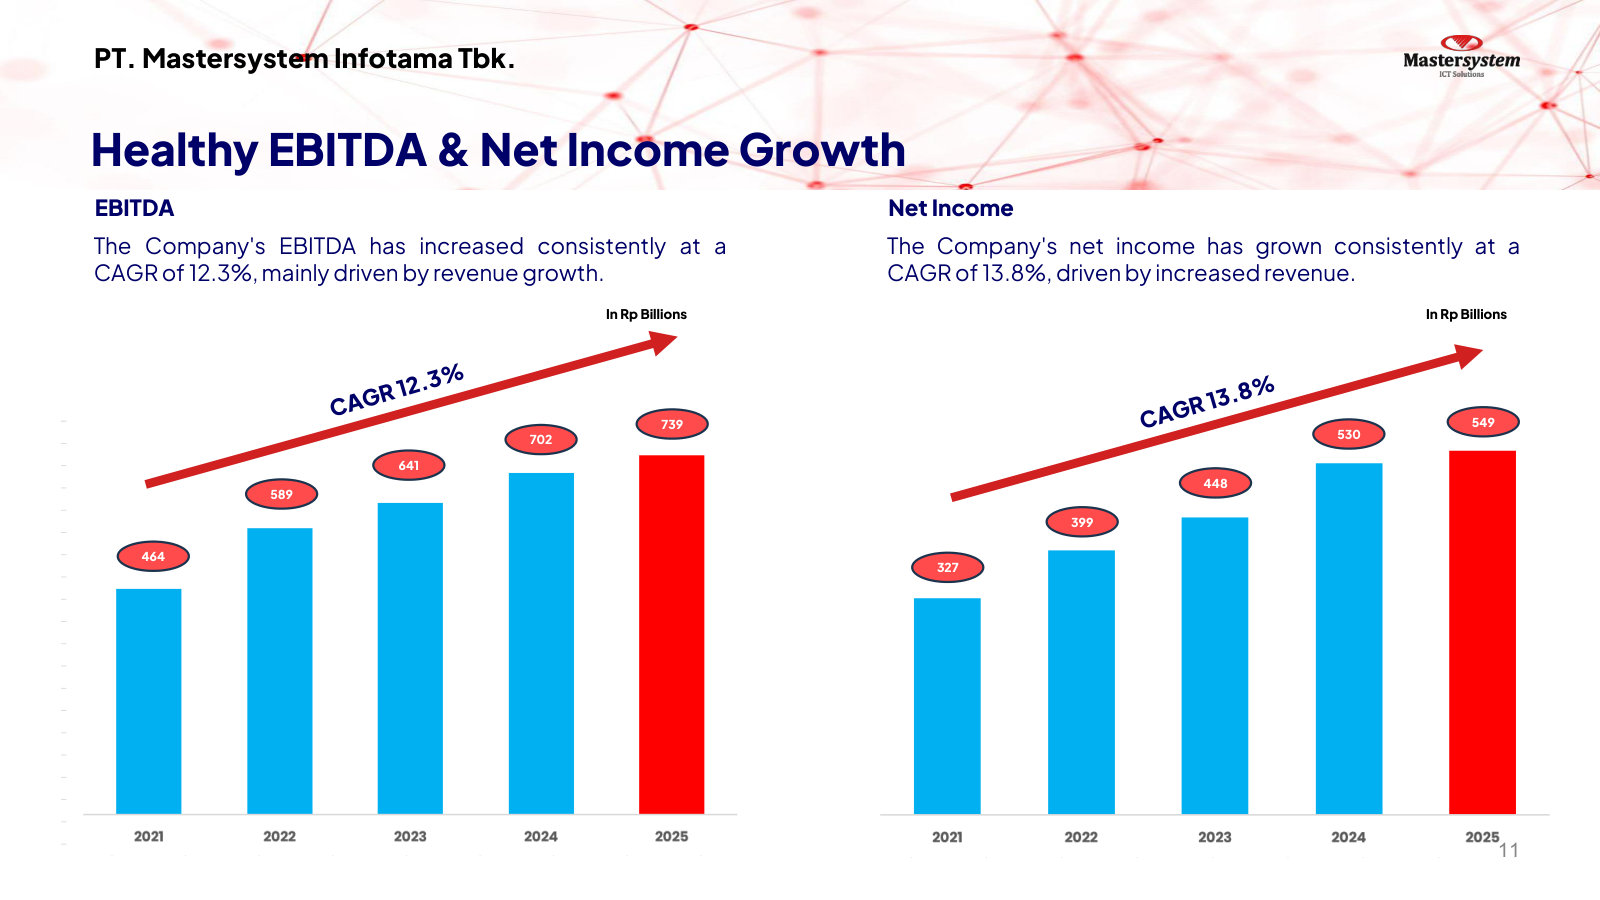
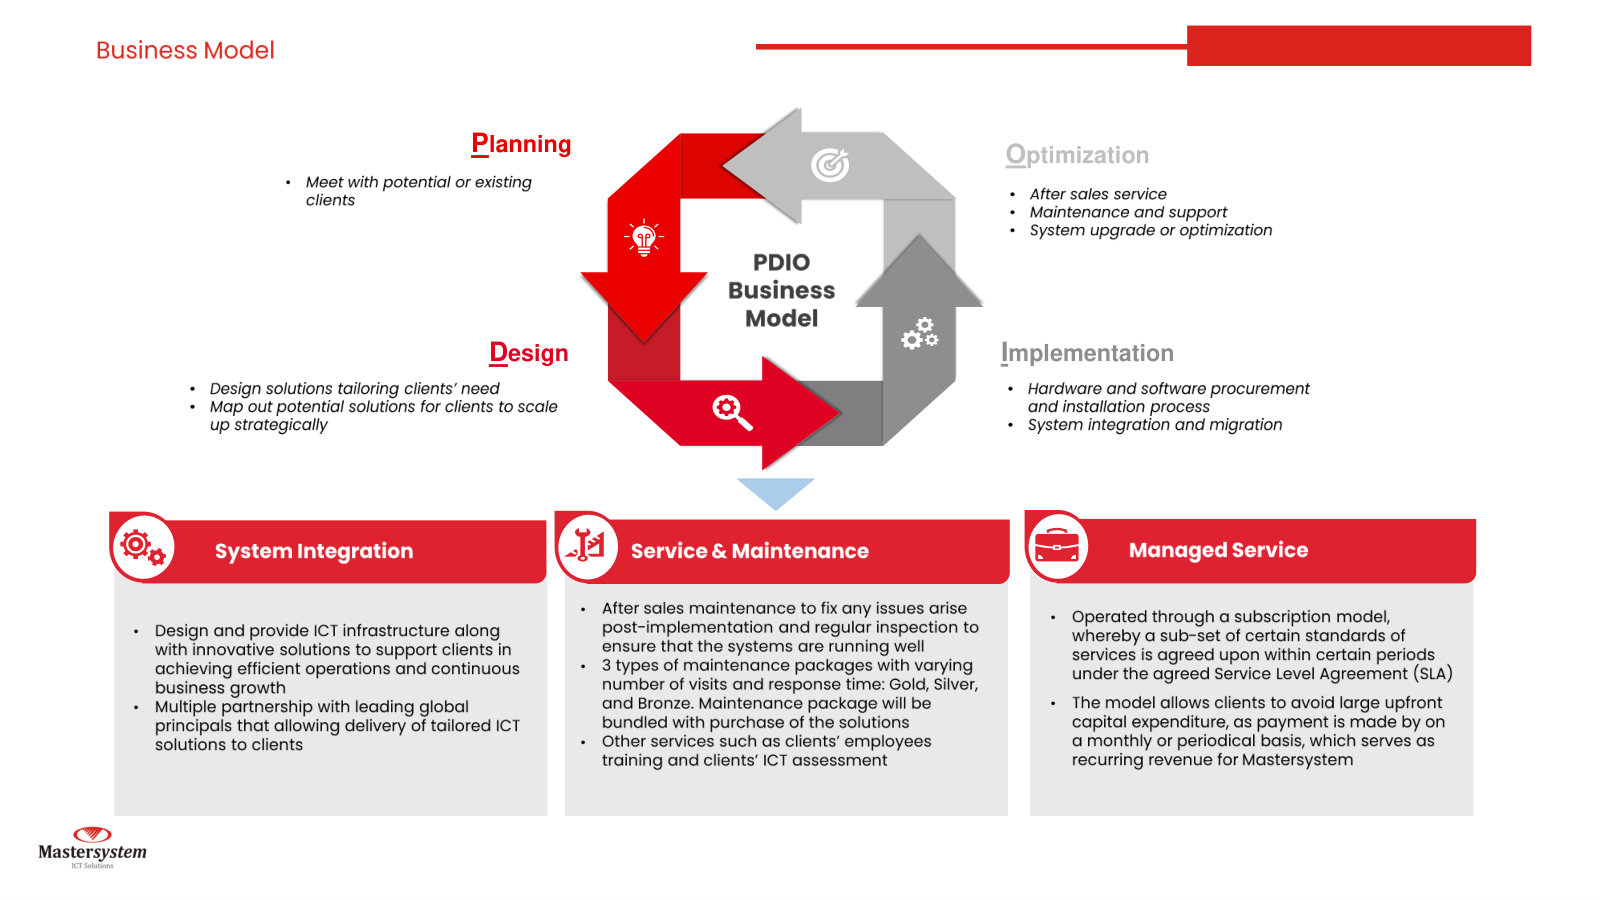
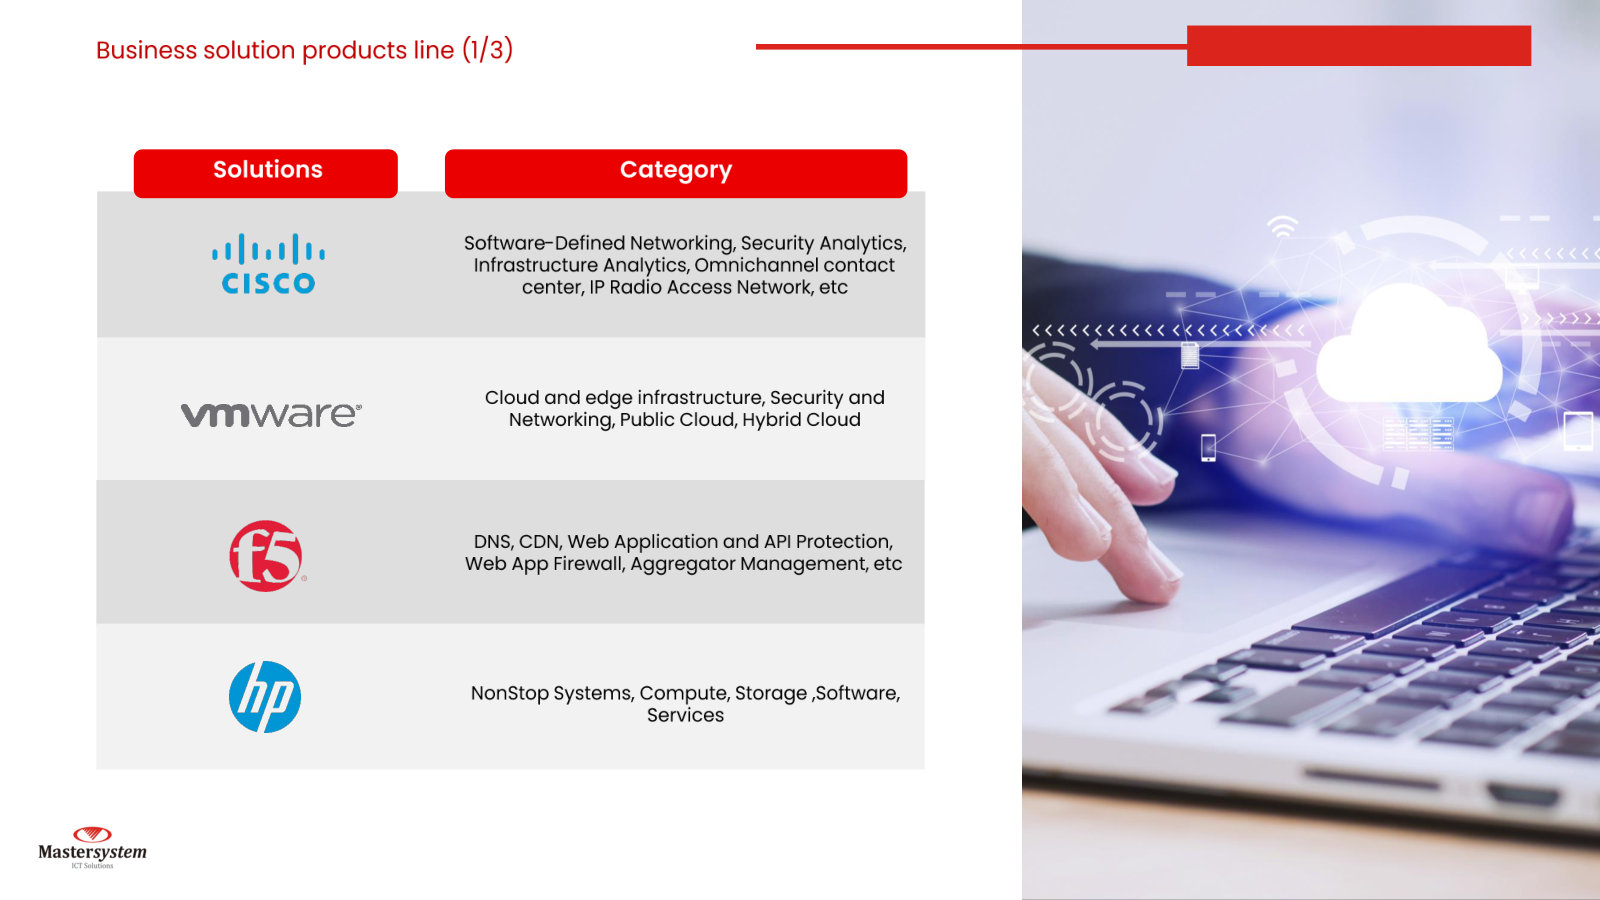
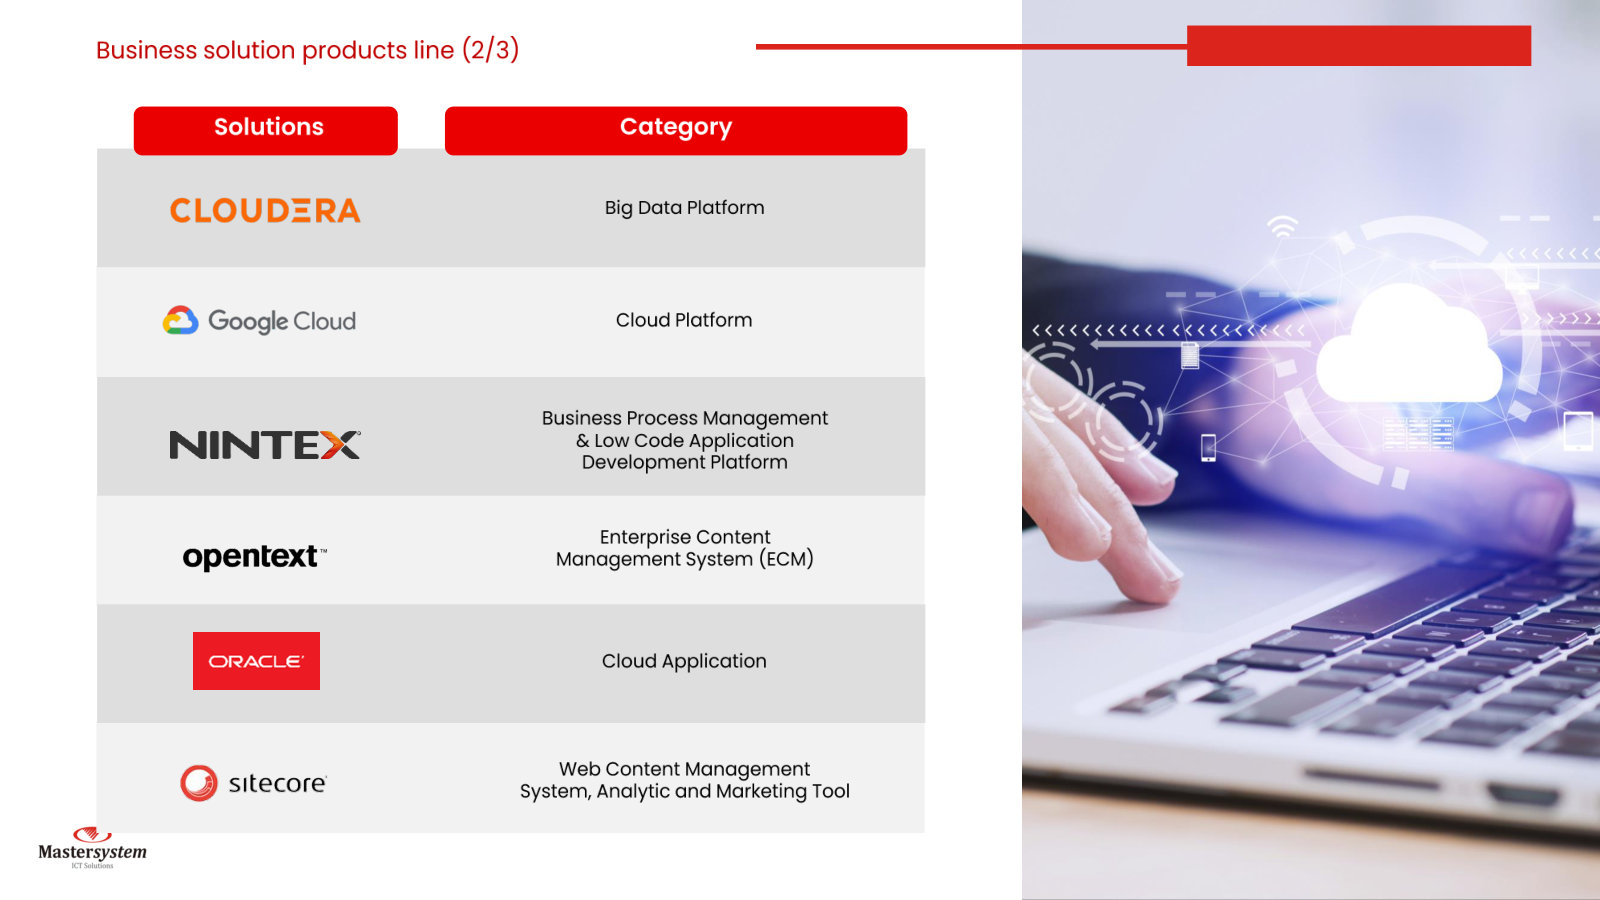
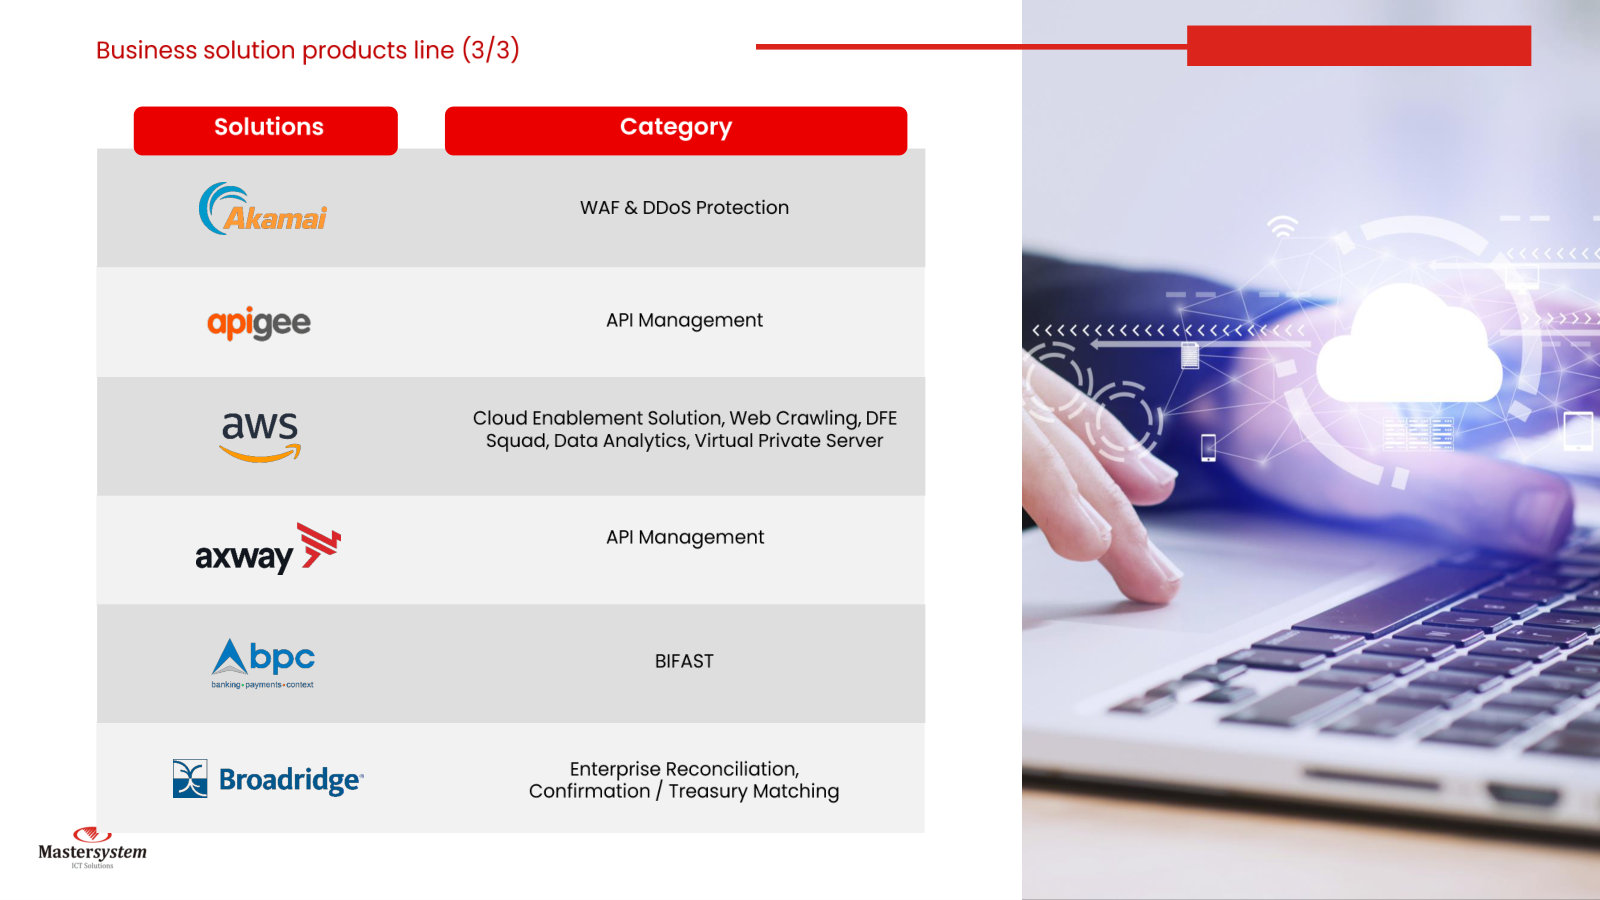
PT Mastersystem Infotama Tbk's management explains the business in its own materials. The slides below do the most of that work, pulled from the documents preserved in Sources. Each source link opens the complete presentation at that slide in a new tab.
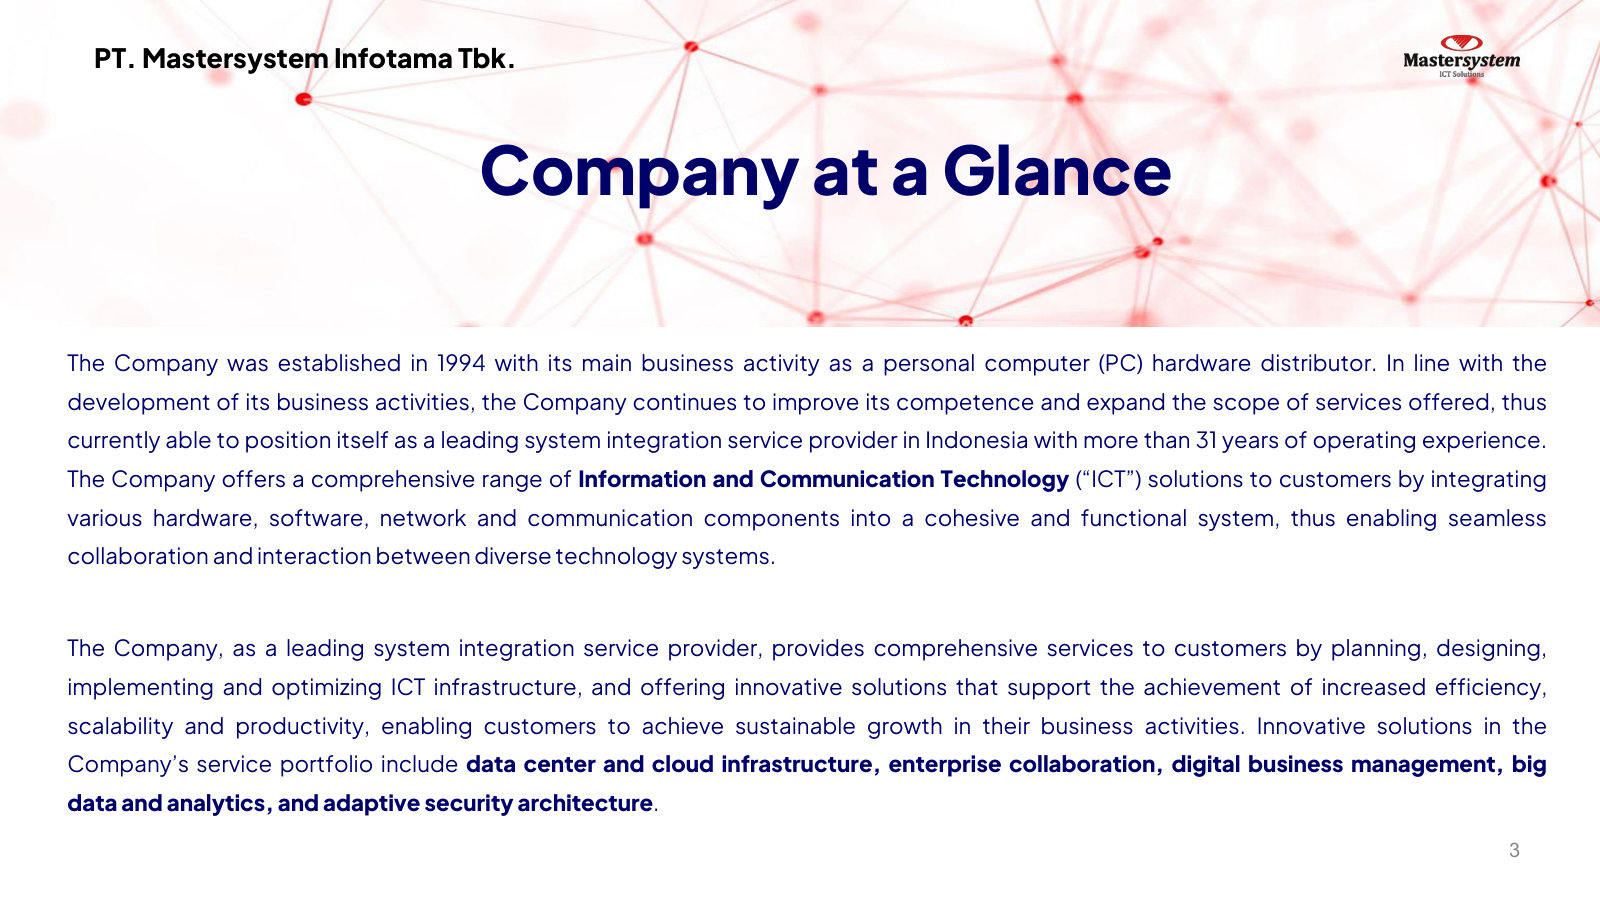
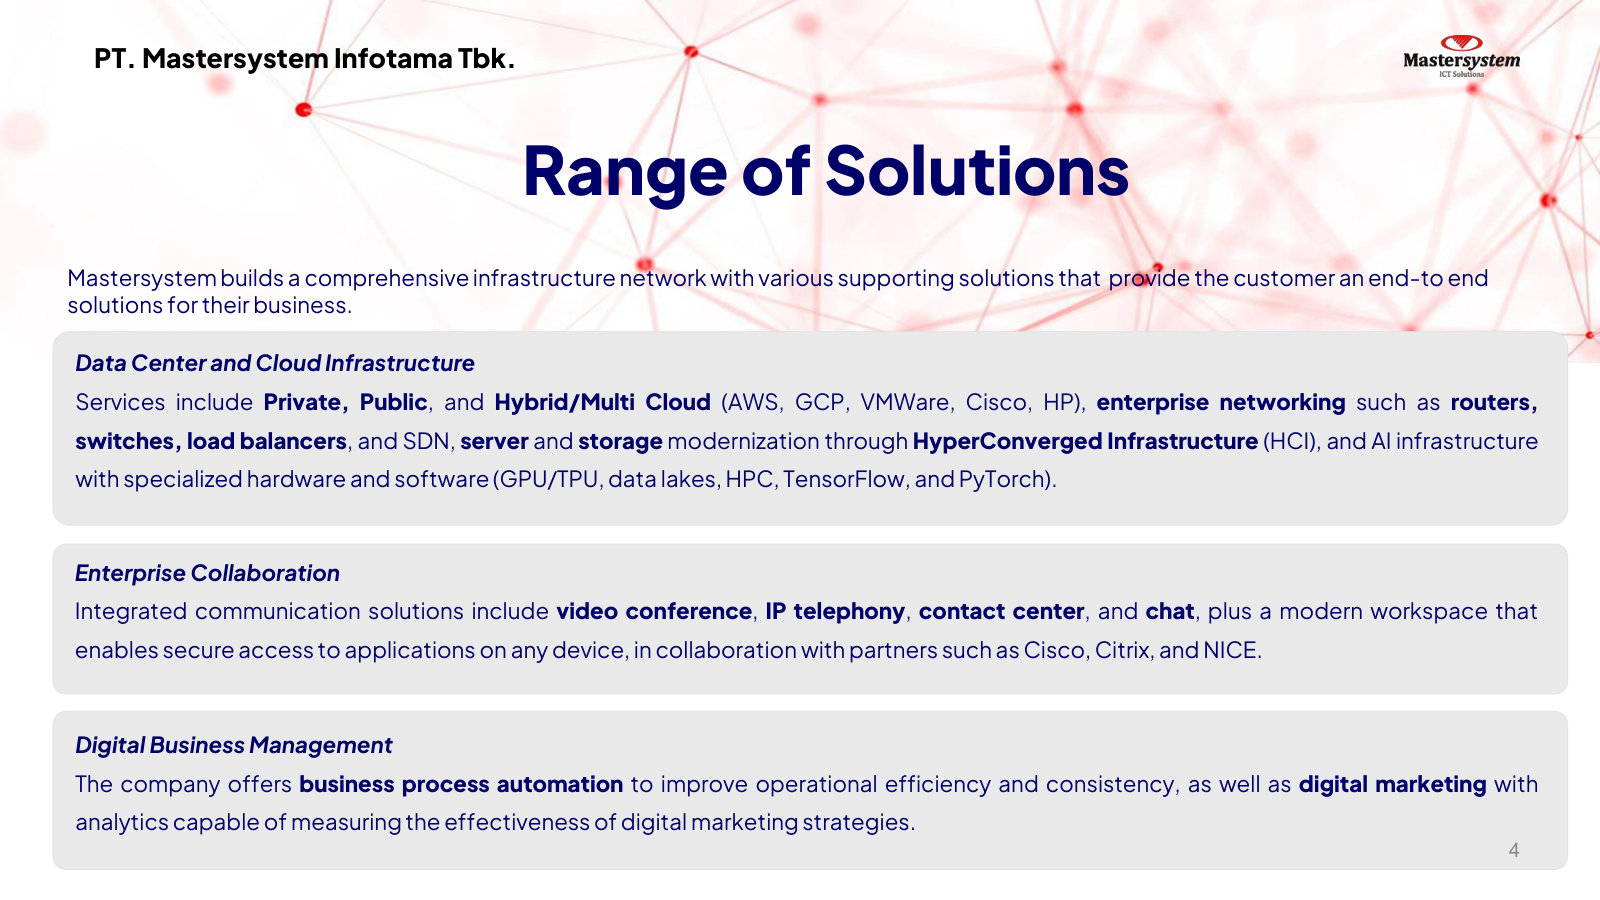
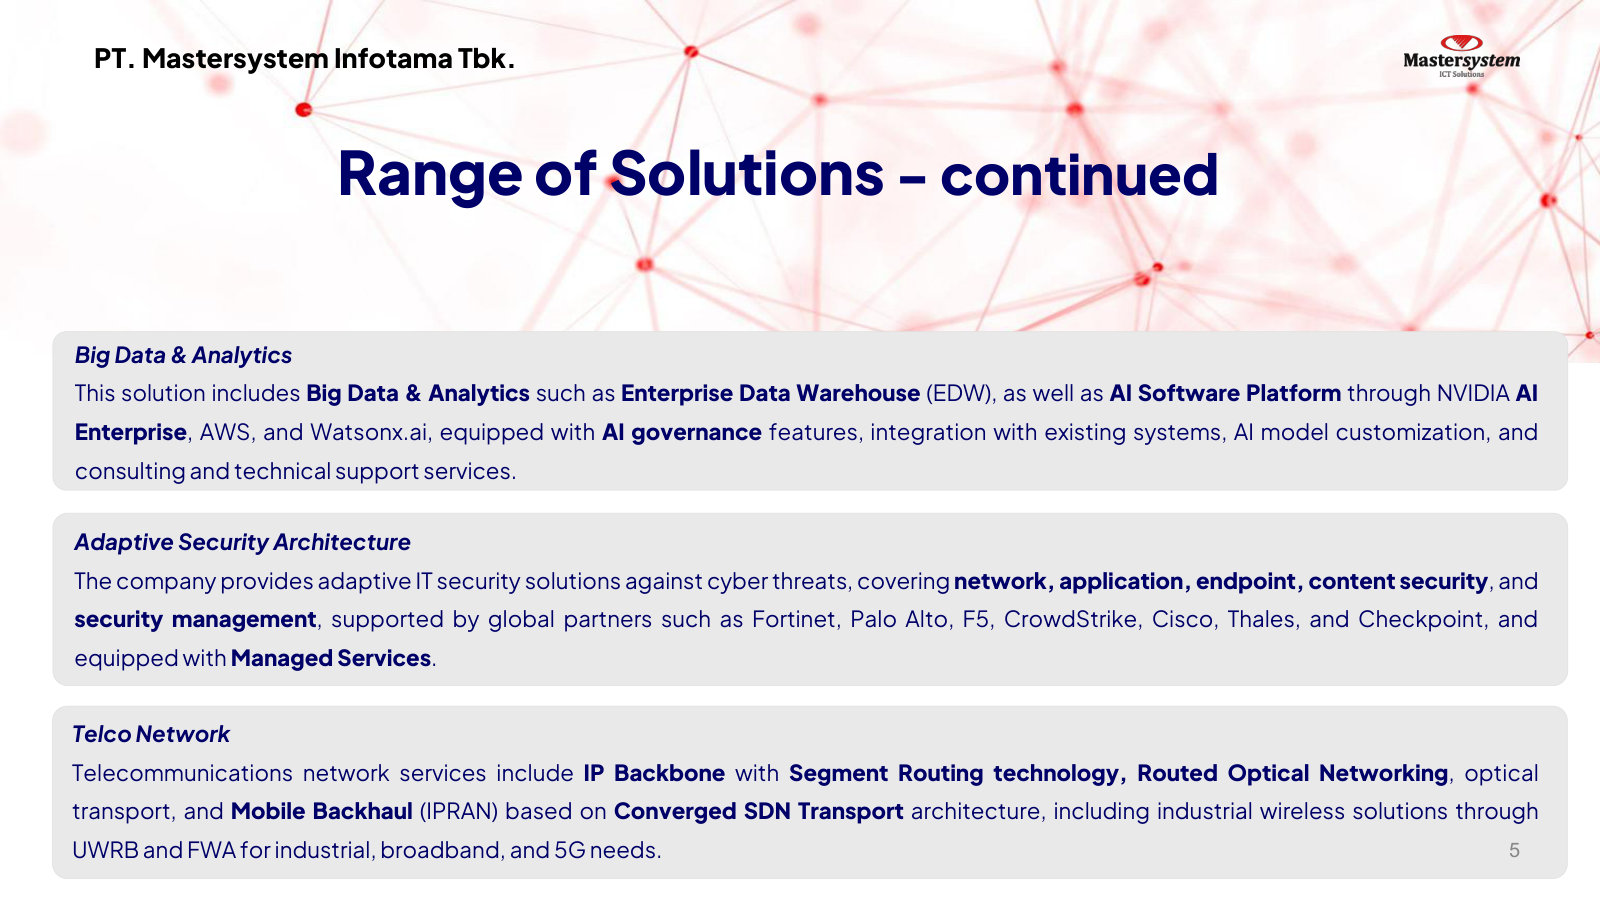
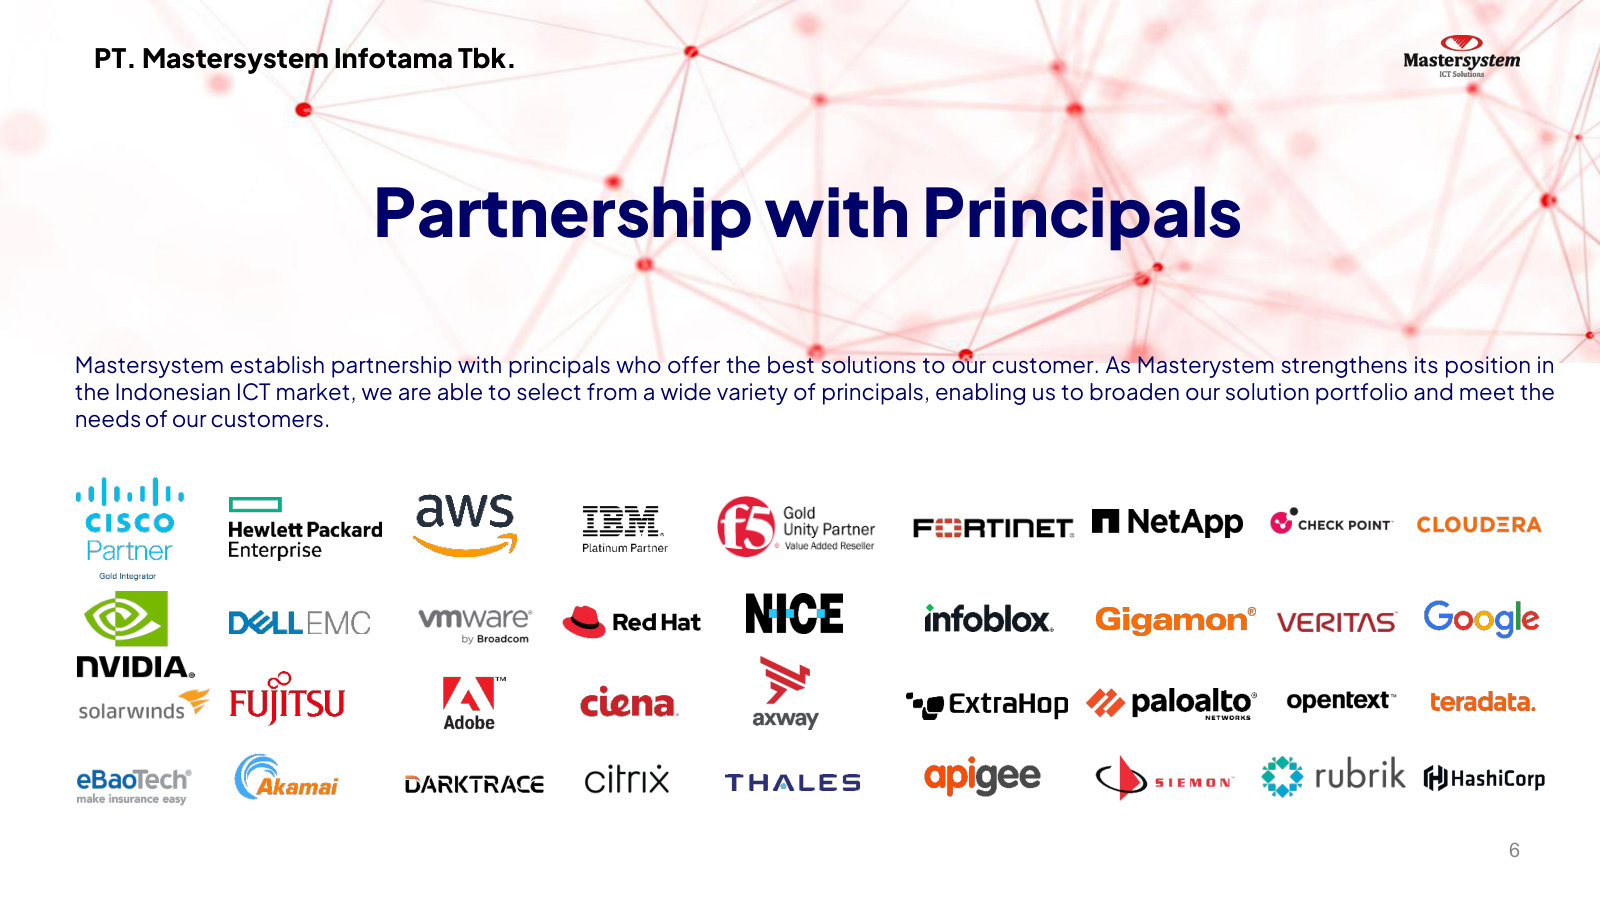
Public Expose — Performance in 2025 — FY2025
Management's most current overview: what the company does, its six solution lines, its principal partners, strategy, and full-year 2025 financials. · Open the full document →
Public Expose 2024 (FY2023, IPO year) — FY2023
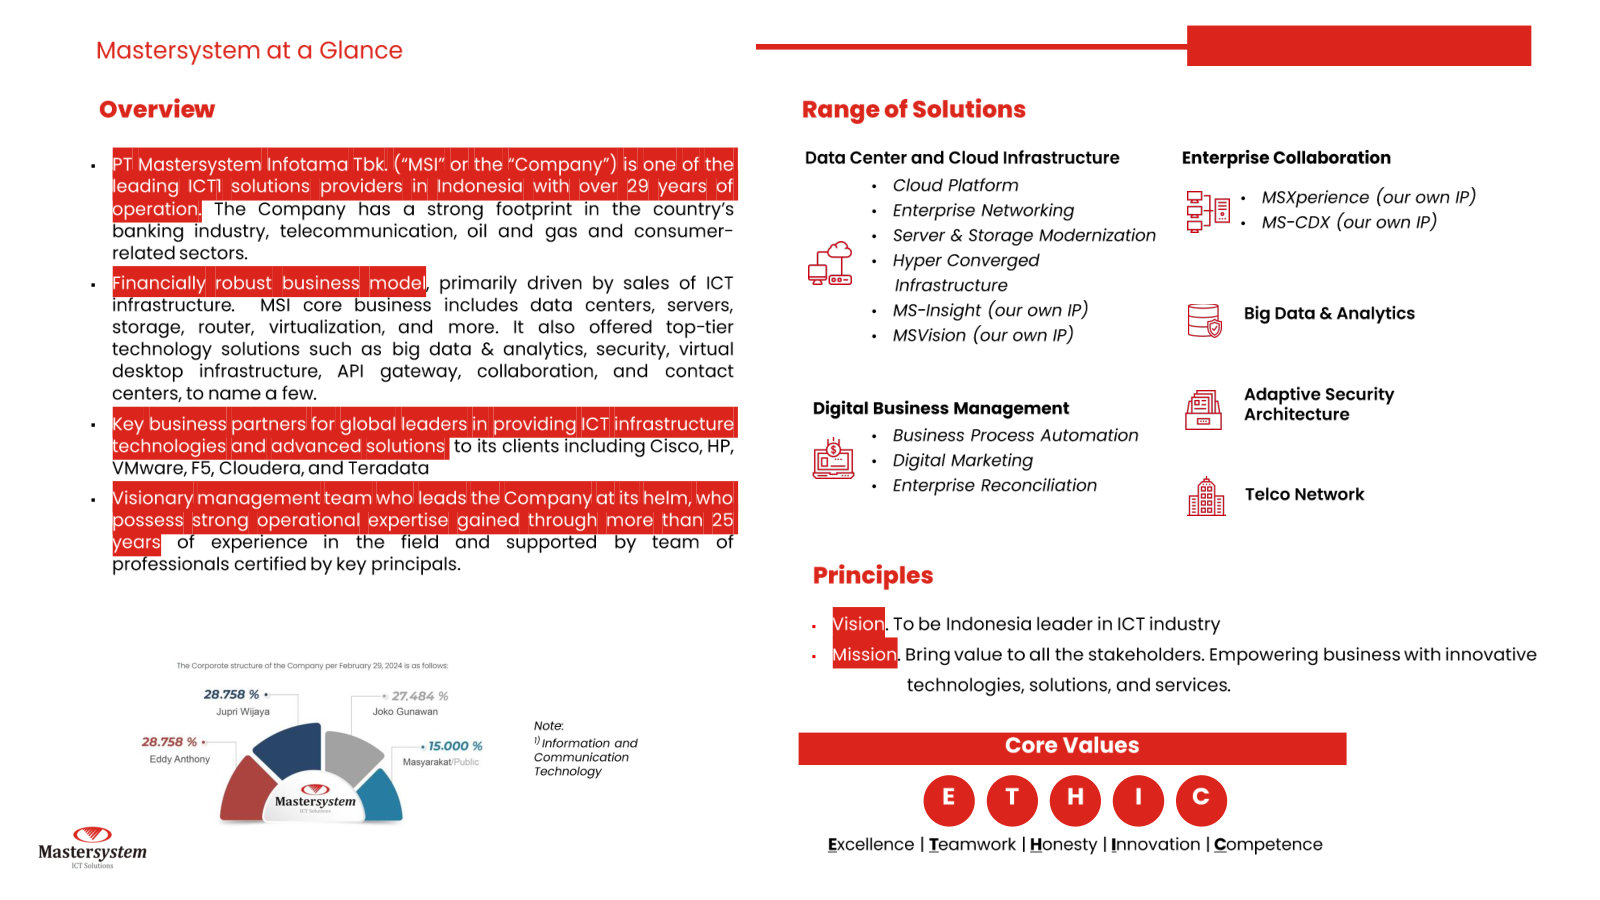
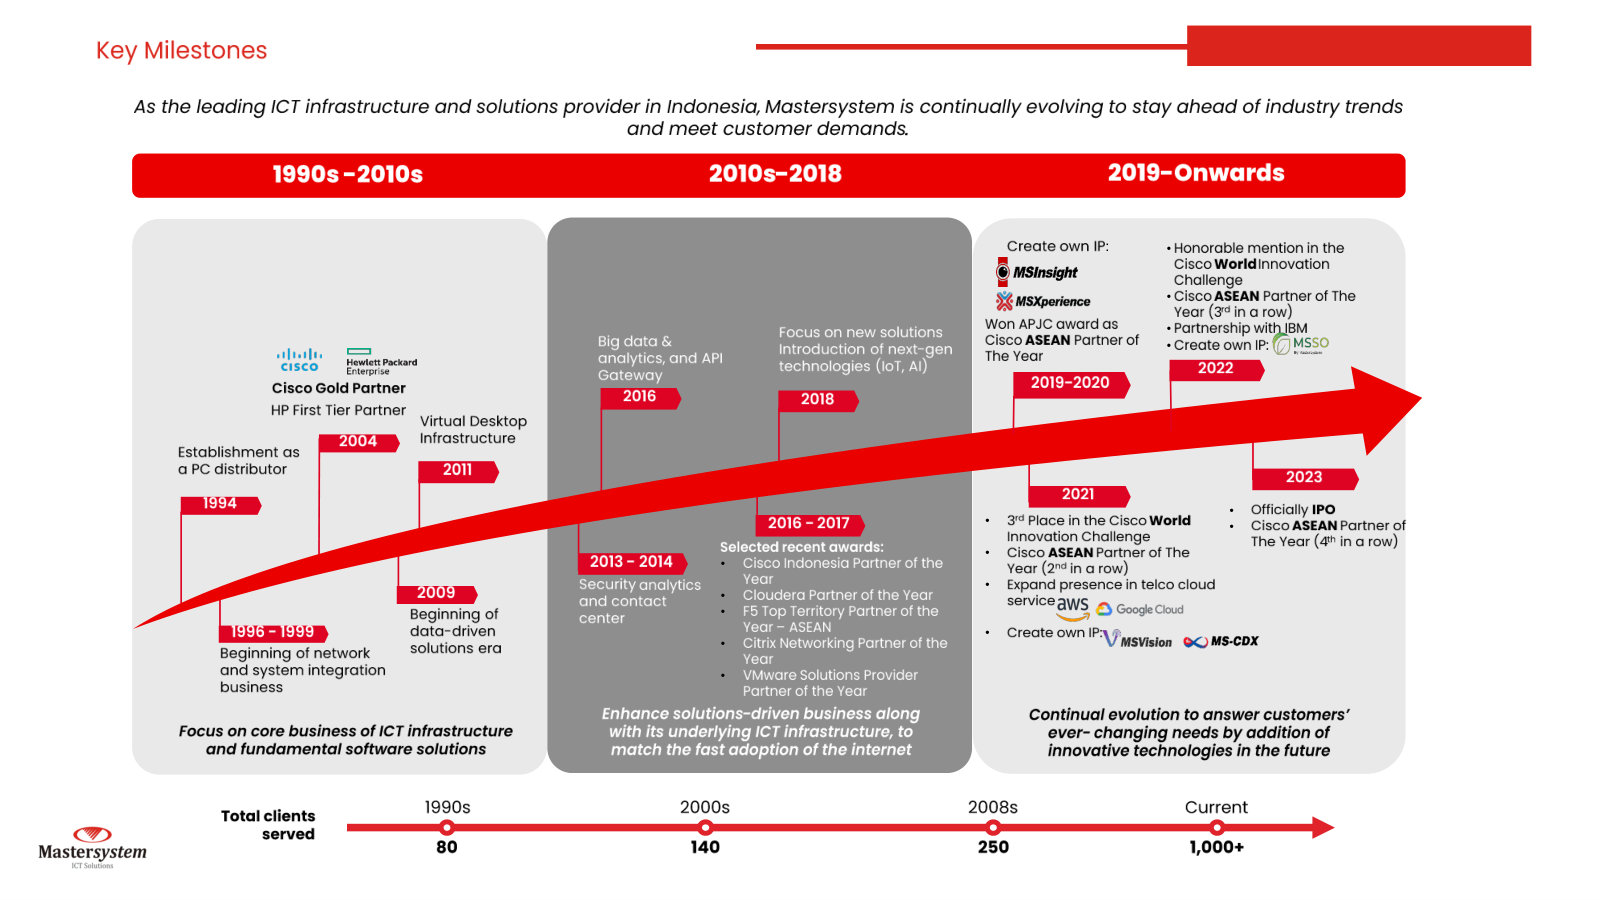
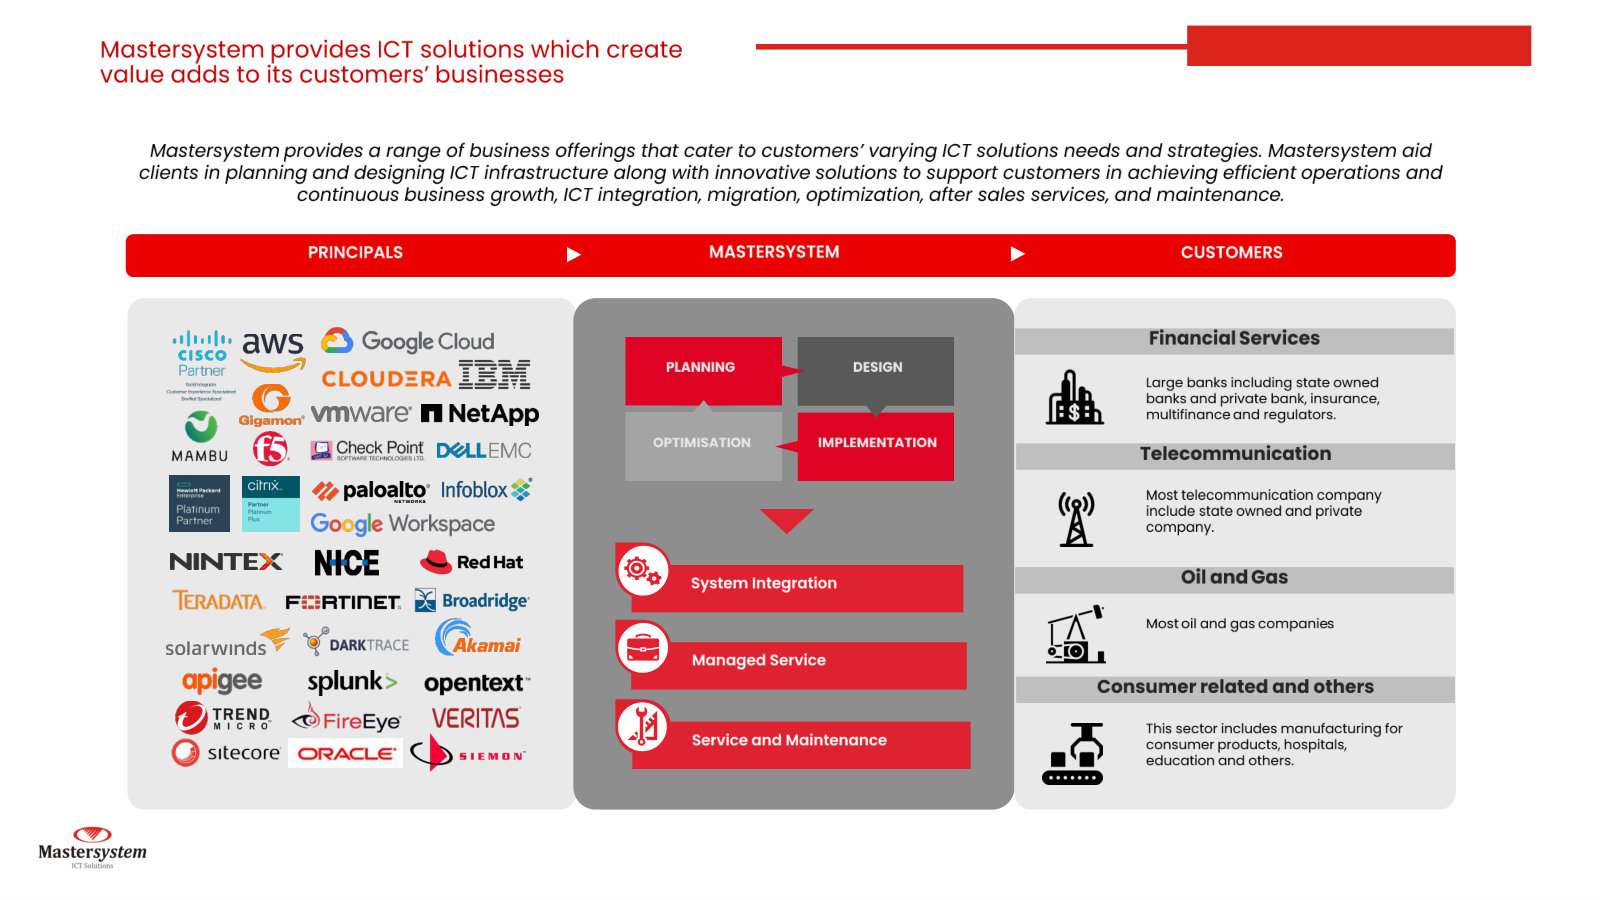
The fullest teardown of how the business actually works — value chain, service model, product catalogue and proprietary IP that later decks summarized away. · Open the full document →
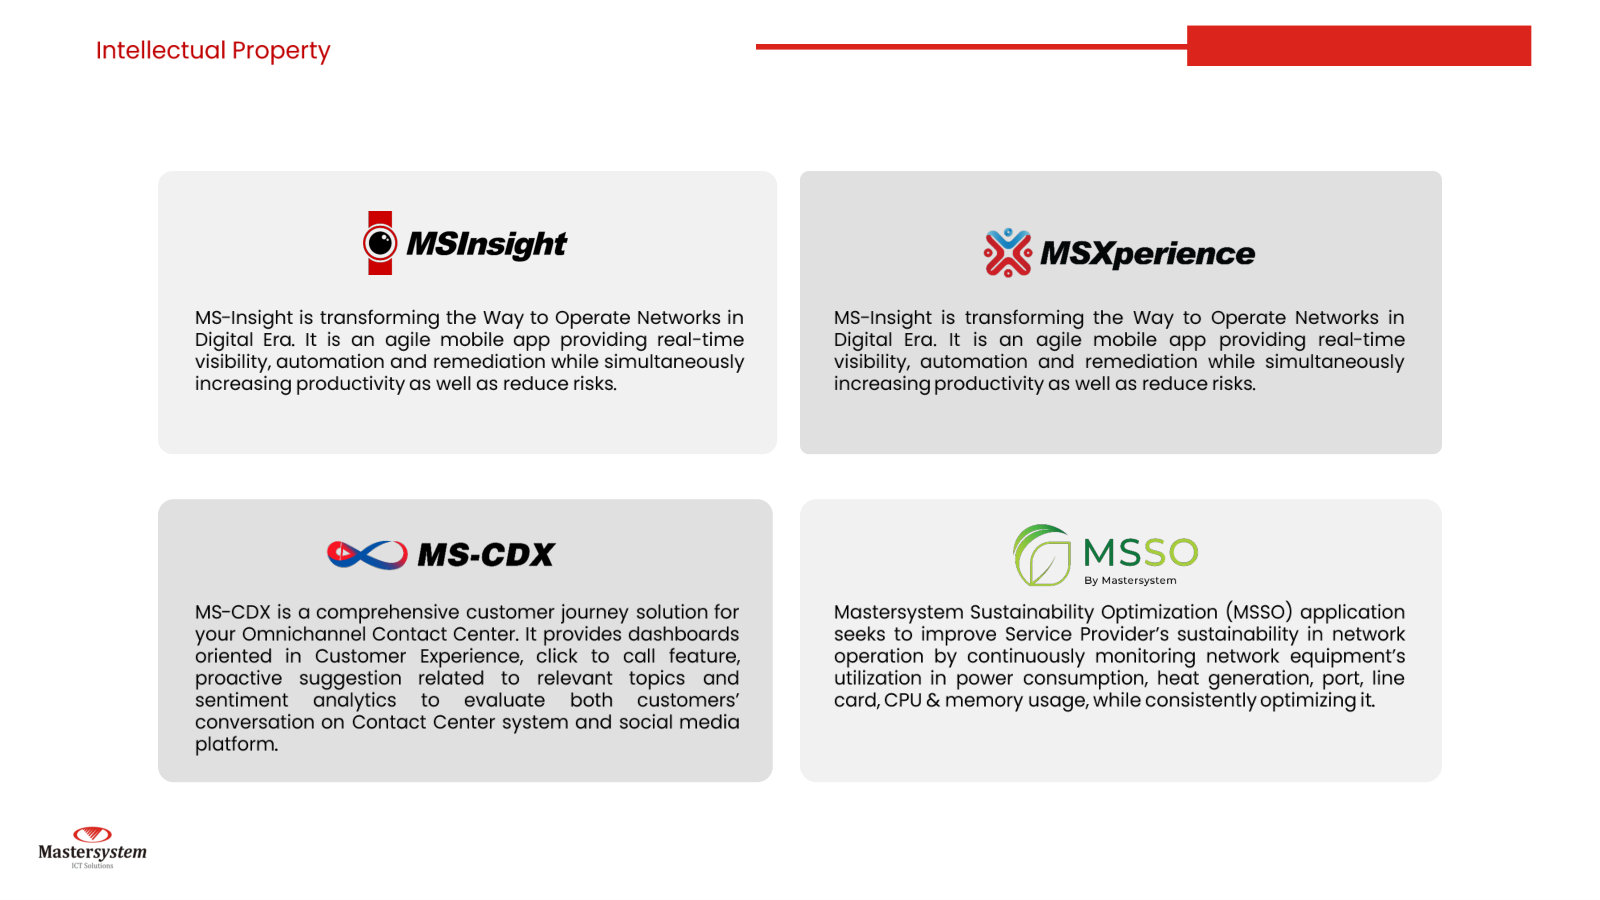
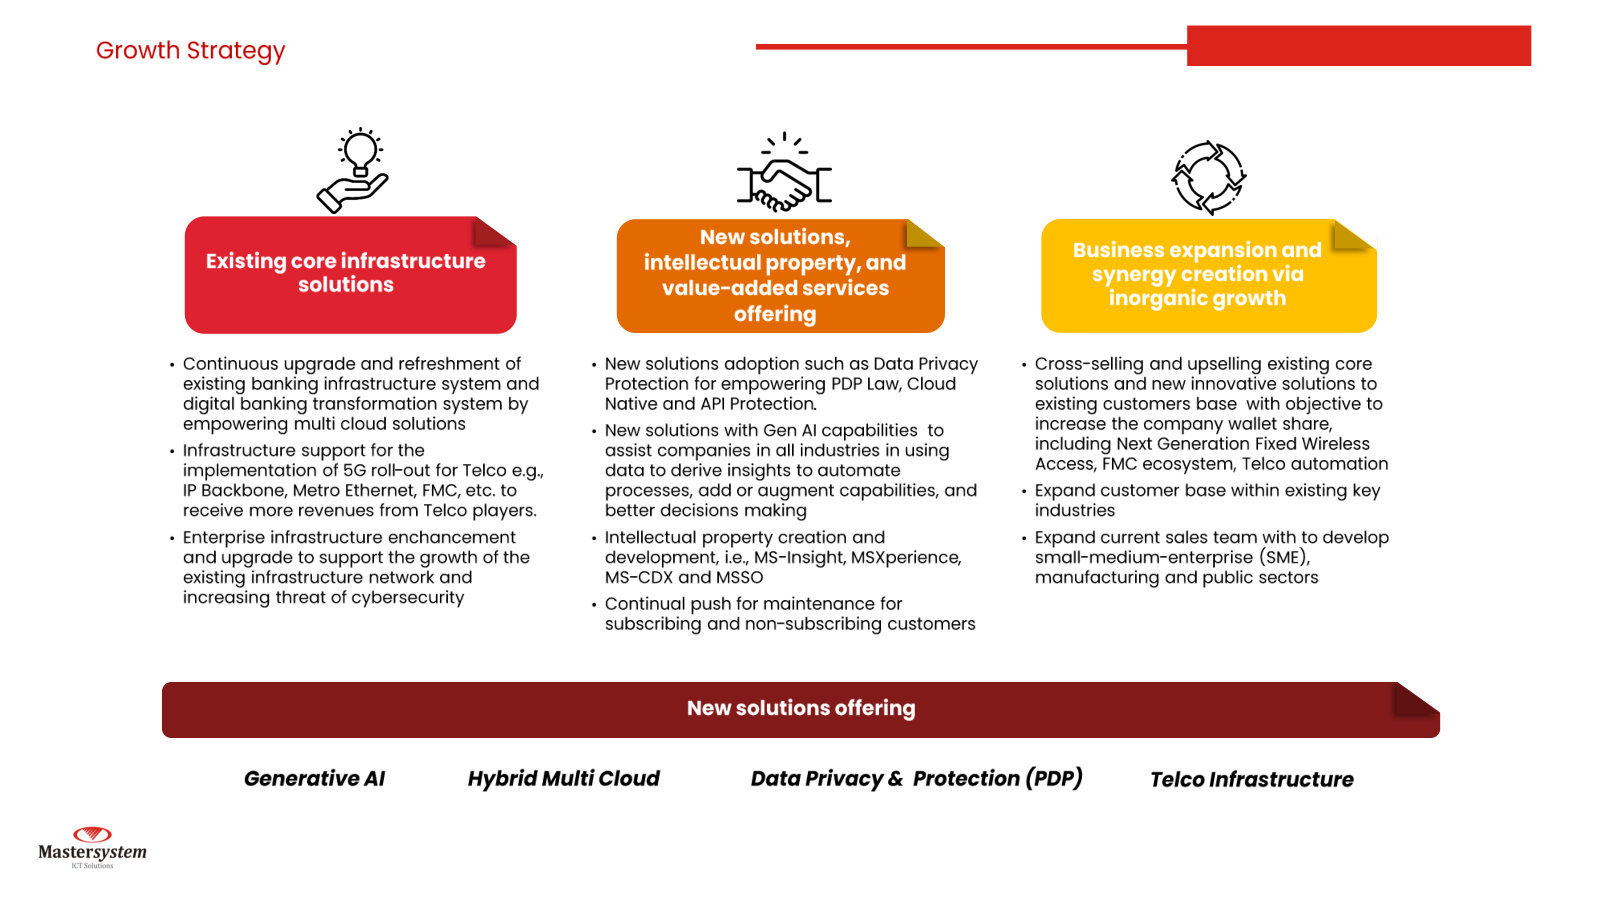
More from management
1Q FY2026 Earnings Call — 1Q FY2026 · 15 pages · The latest quarterly print for readers who want the most recent trading update after the FY2025 public expose. · Open →
Public Expose 2025 (FY2024) — FY2024 · 17 pages · The prior-year overview, with a company-journey timeline and more granular FY2024 revenue-by-segment and ratio slides. · Open →
FY2023 Earnings Call — FY2023 · 17 pages · The only deck carrying explicit FY2024 guidance, set just after the November 2023 IPO. · Open →
PT Mastersystem Infotama Tbk's annual reports contain management's most considered account of the business. These are the sections, passages and visual pages worth opening in the originals preserved in Sources.
PT Mastersystem Infotama Tbk — 2025 Integrated Annual Report — FY2025
Latest report; management explains a flat 1.7% revenue year (Rp5.45tn) as normalization after 2024's one-off AI Factory project, and the pivot to recurring managed services. · Open the full document →
Board of Directors' Report — p. 30 · Read the full section →
Management's own read on the year: why growth stalled, the reset to three focus solutions, and the shift from one-time deals to recurring revenue.
Why 2025 was flat: 2024's growth leaned on a non-recurring AI Factory project.
In line with the Company’s business plan, Mastersystem recorded a 1.7% increase in net sales to Rp5,454,702 million, compared to Rp5,361,540 million in the previous year, reflecting stable performance. […] This achievement was primarily influenced by a high comparative base in the prior year, when 2024 sales growth was supported by the non-recurring contribution of the AI Factory project. Against this backdrop, the 2025 performance reflects a healthy phase of normalization, as well as the Company’s continued ability to sustain business stability amid evolving industry conditions.
p. 35 · Read in context →
The strategic pivot: turning one-time transactions into recurring managed-services revenue.
We also continue to expand managed services and broaden our service portfolio by transforming our business model from one-time transactions to recurring revenue streams. This approach allows for increased recurring income while delivering more consistent, reliable, and secure services to customers.
p. 34 · Read in context →
The Company's Activities, Line of Business, and Products — p. 51 · Read the full section →
What MSTI actually is: an end-to-end ICT system integrator that resells and implements global principals' hardware and software, plus its own IP.
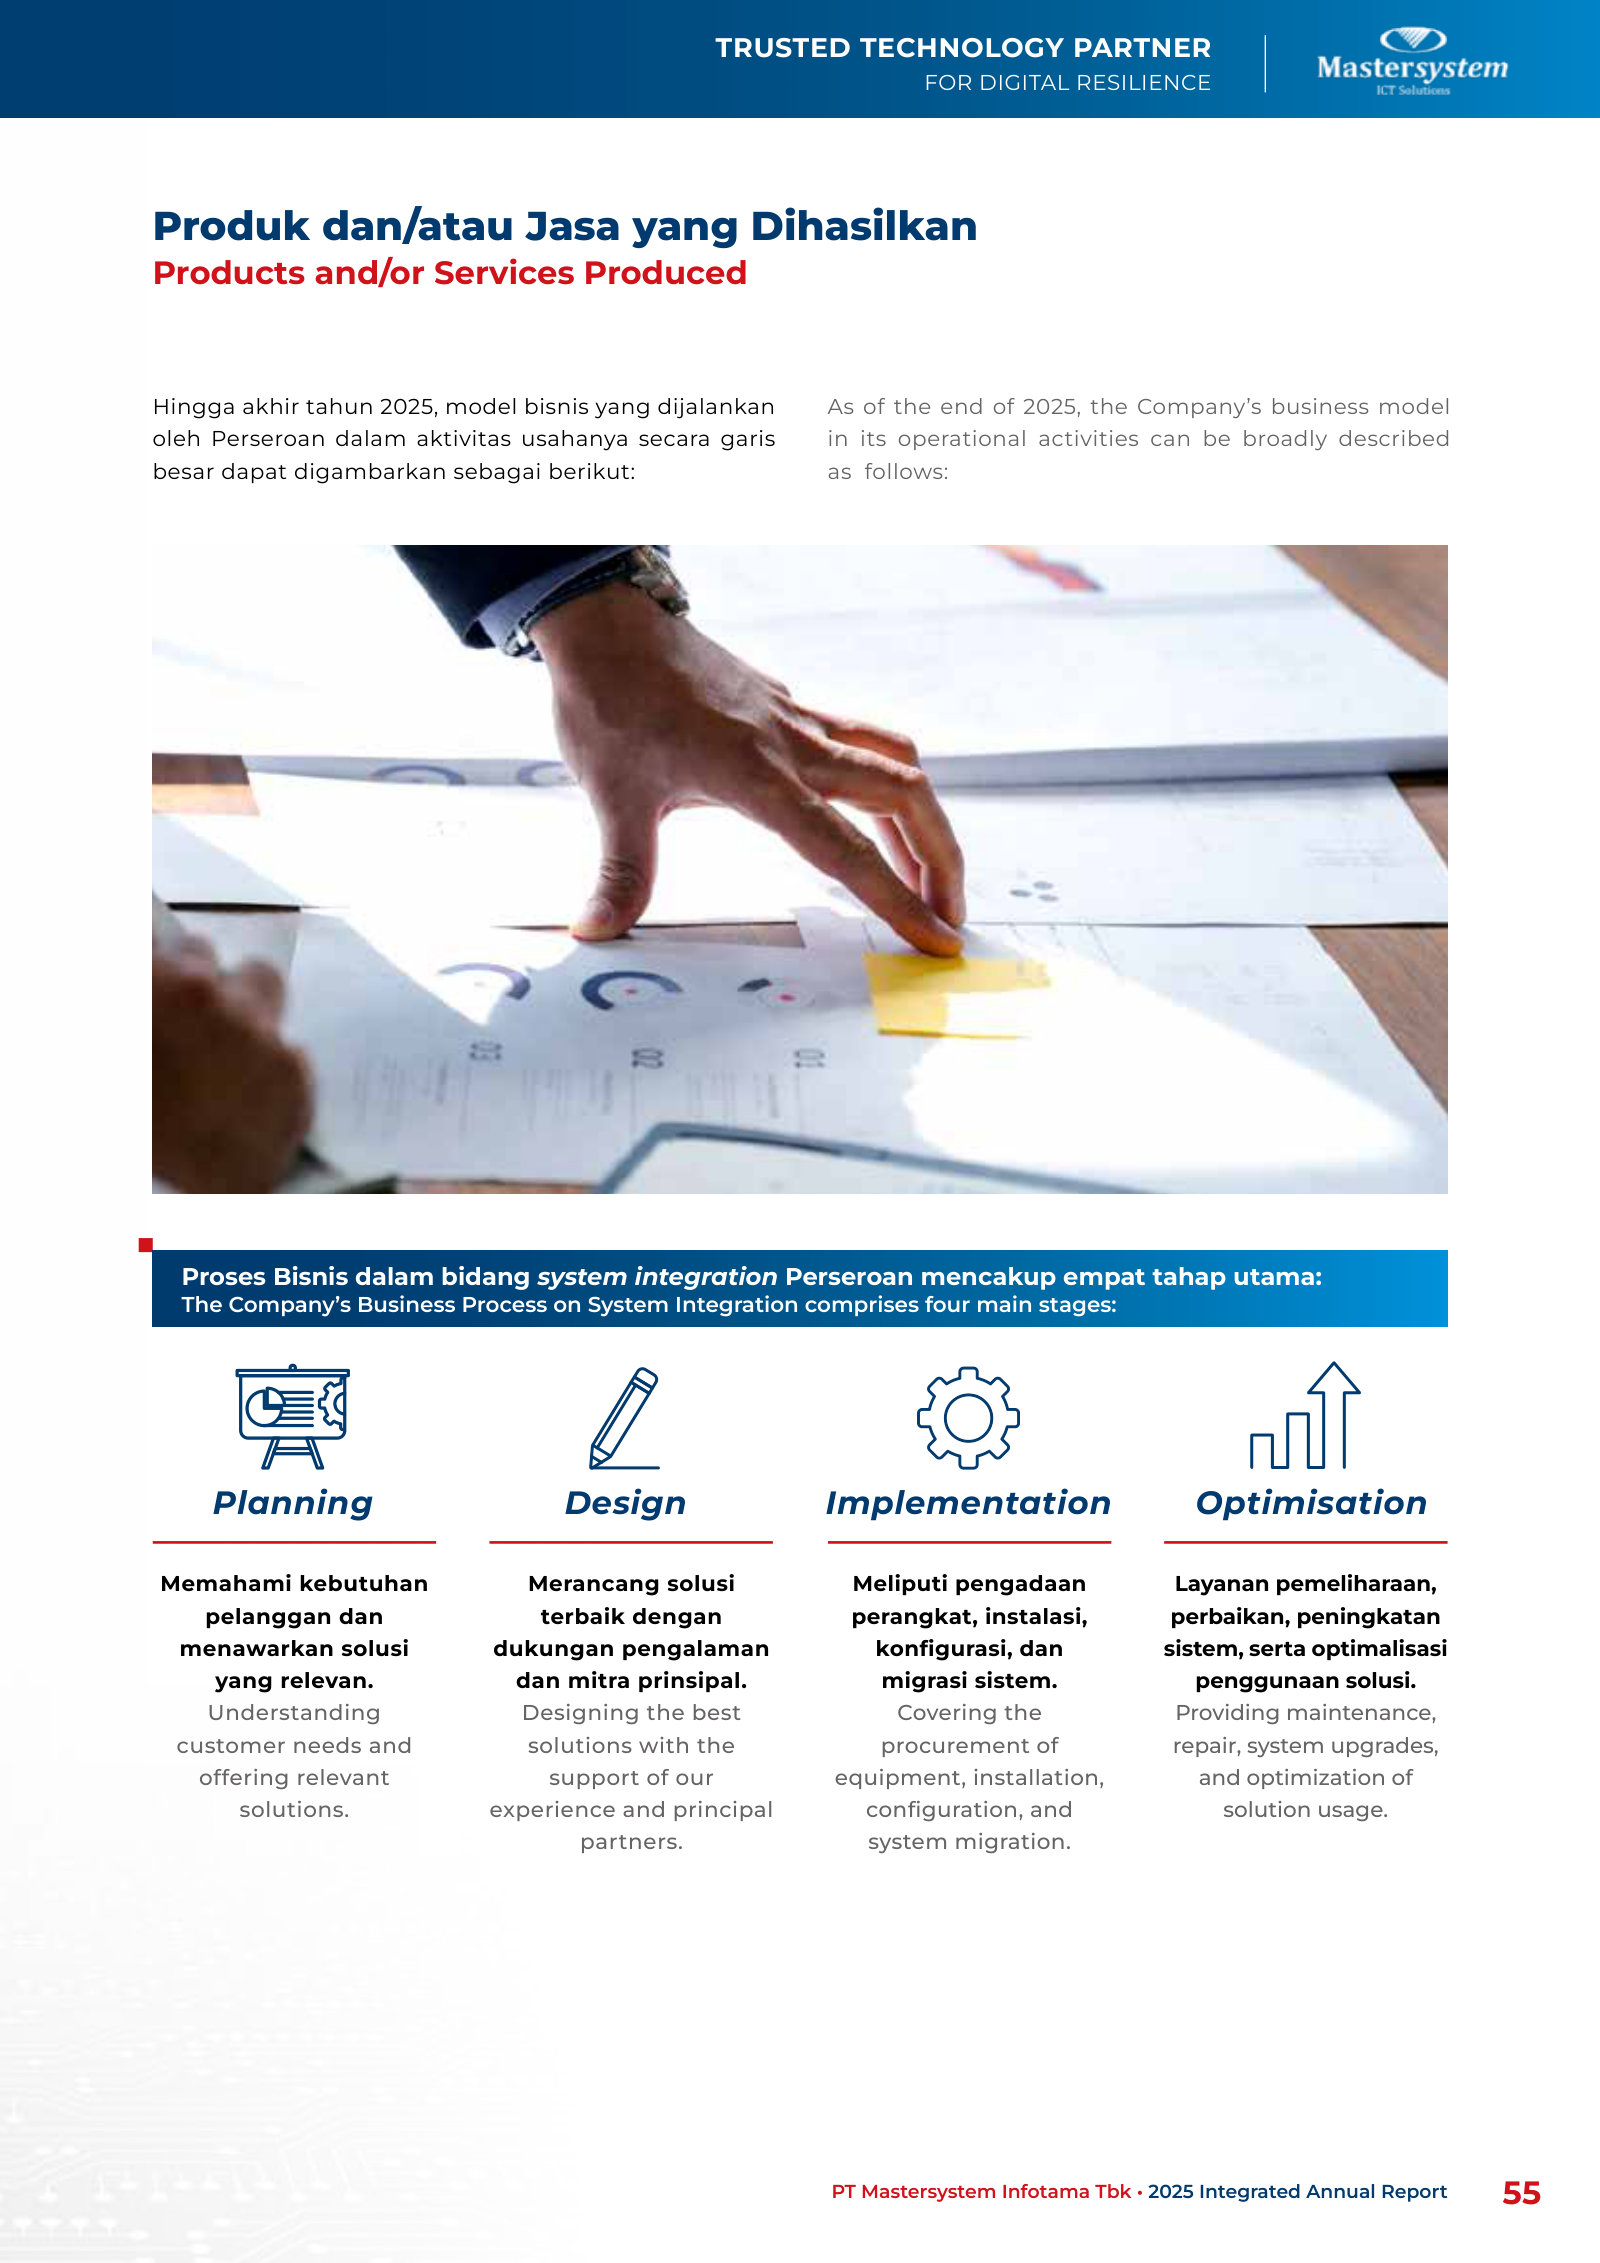
In-house IP alongside reselling — including 2025 launches MANTRA (GenAI) and AmanTerus.
The Company has also developed a range of internal solutions, including MS-Insight for real-time network monitoring, MSXperience as a Cisco Webex-based collaboration platform, MS-CDX for Omnichannel Contact Center, MSSO as a solution for monitoring power consumption and network sustainability, and MS3 for black box security testing. In addition, the Company launched two new solutions in 2025, namely MANTRA (Mastersystem AI Navigator for Tasks, Responses, and Assistance), a Generative AI Enterprise solution that provides an intelligent digital assistant powered by internal data, as well as AmanTerus, a digital protection application for Android devices.
p. 57 · Read in context →
MD&A — Sales and Profitability by Business Segment — p. 102 · Read the full section →
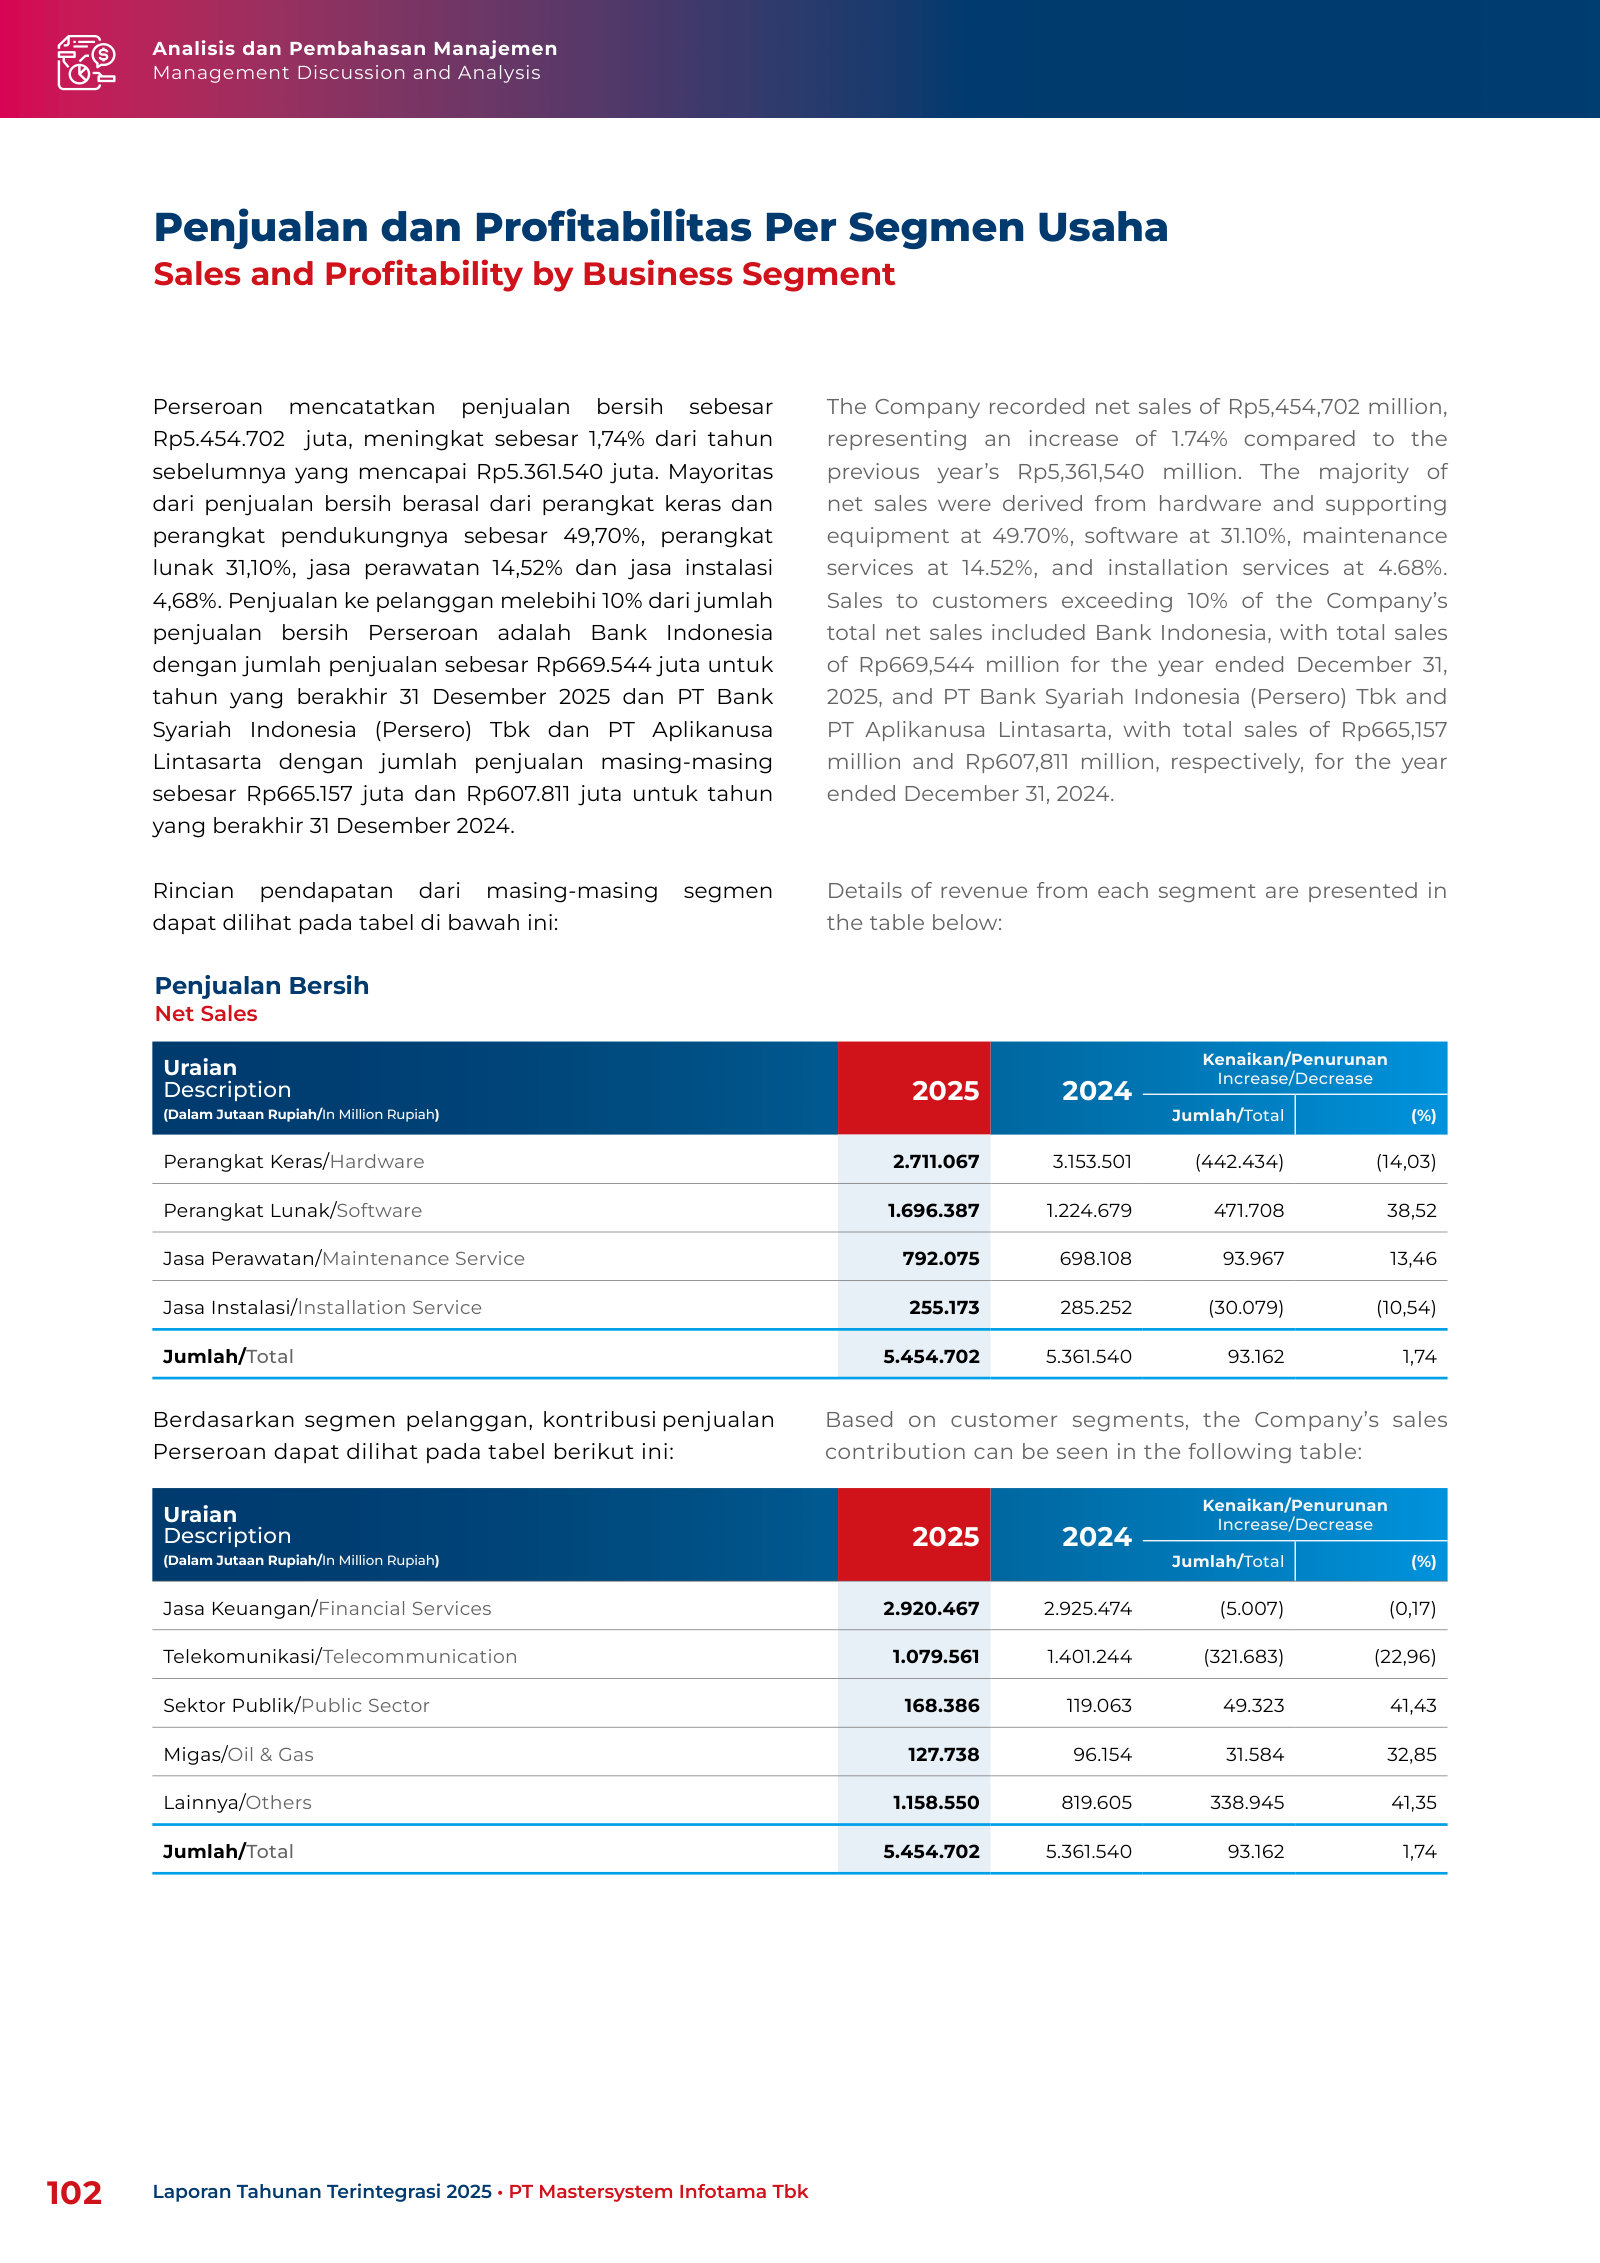
How the money is made and its concentration: revenue split by product and customer sector, with three clients each above 10% of sales.
Revenue mix: hardware 49.7%, software 31.1%, maintenance 14.5%, installation 4.7%; Bank Indonesia the top client.
The Company recorded net sales of Rp5,454,702 million, representing an increase of 1.74% compared to the previous year’s Rp5,361,540 million. The majority of net sales were derived from hardware and supporting equipment at 49.70%, software at 31.10%, maintenance services at 14.52%, and installation services at 4.68%. Sales to customers exceeding 10% of the Company’s total net sales included Bank Indonesia, with total sales of Rp669,544 million for the year ended December 31, 2025, and PT Bank Syariah Indonesia (Persero) Tbk and PT Aplikanusa Lintasarta, with total sales of Rp665,157 million and Rp607,811 million, respectively, for the year ended December 31, 2024.
p. 102 · Read in context →
MD&A — Financial Overview — p. 104 · Read the full section →
The P&L walk in one table: ~18% gross margin and ~10% net margin, the thin-but-steady economics of a reseller/integrator.
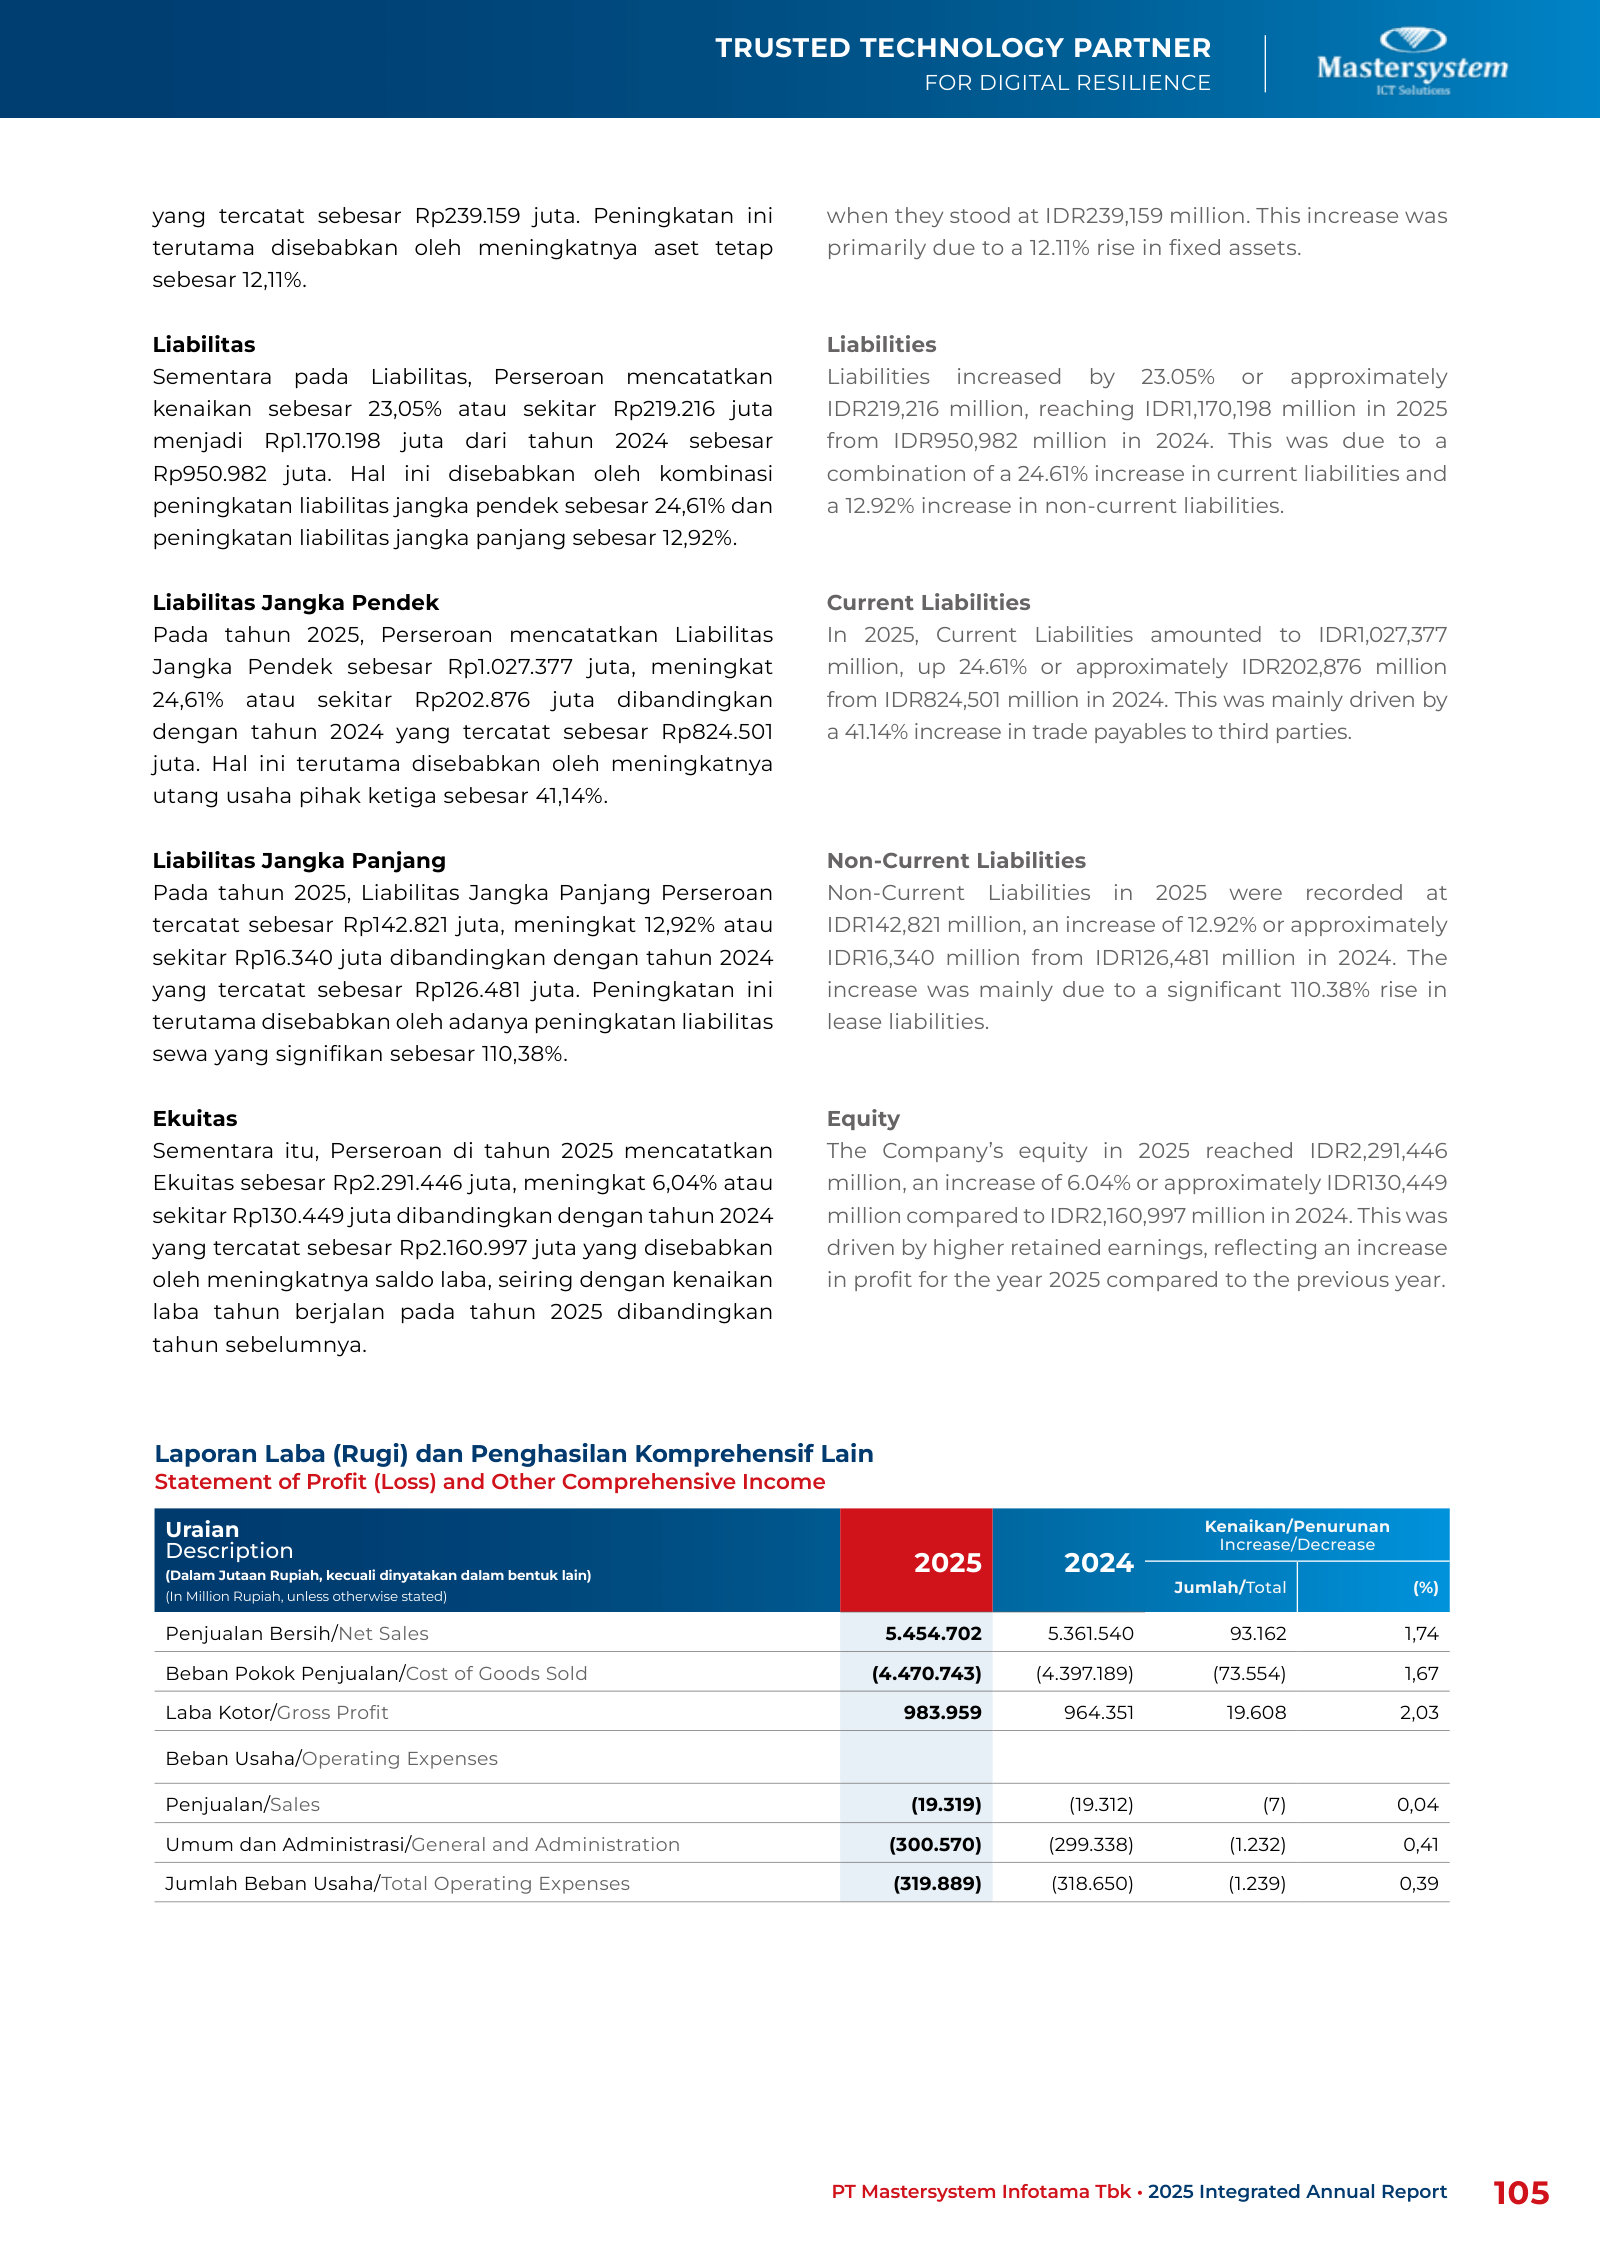
Risk Management — Risk Profile in 2025 — p. 192 · Read the full section →
The company-specific risks that can bite: lumpy project-based revenue tied to a ~3-year hardware refresh, and heavy financial-sector concentration.
Concentration risk: diversifying away from financial services into telco and oil & gas.
The Company's management recognizes that excessive dependence on clients in the financial services industry can pose risks. Therefore, management has taken diversification measures by establishing dedicated sales sub-divisions focusing on the telecommunications as well as the oil and gas industries. As a result, the Company's sales in the telecommunications sector have shown positive growth, thereby reducing reliance on the financial services sector.
p. 193 · Read in context →
Notes — 2.q Revenue and Expense Recognition — p. 286 · Read the full section →
The accounting policy that defines the model: revenue booked gross as principal; hardware/software at a point in time, services over time.
Booked gross as principal; hardware/software recognised at point of delivery and acceptance.
Revenues in the agency relationship are recorded at the amount of gross invoices to customers when the Company acts as principal in the sale of goods and services. […] Revenue from sales of hardware and software is recognized at point in time which generally coincide with their delivery and acceptance.
p. 287 · Read in context →
More annual reports
PT Mastersystem Infotama Tbk — 2024 Integrated Annual Report — FY2024 · 339 pages · The peak year: net sales jumped 27.6% to Rp5.36tn, lifted by the one-off AI Factory project that makes 2025 look flat by comparison. · Open →
PT Mastersystem Infotama Tbk — 2023 Integrated Annual Report — FY2023 · 320 pages · First report after the November 2023 IPO — the business, governance and use-of-proceeds as presented to public investors at listing. · Open →
Competitors describe PT Mastersystem Infotama Tbk's market in their own filings and calls. These verified passages and visual pages show where their strategies meet, using source documents preserved in Sources.
PT Indointernet Tbk (Indonet / Digital Edge Indonesia) (EDGE)
The closest listed Indonesian peer to Mastersystem in enterprise digital infrastructure. Indonet runs the Digital Edge Indonesia data centers (EDGE1/EDGE2), enterprise connectivity, and cloud services, chasing the same banking, corporate and telco IT budgets in Indonesia that MSTI's data-center, cloud and system-integration business targets. Uniquely useful here because Indonet's MD&A sizes the very Indonesian ICT market MSTI sells into and names the multinational vendors (IBM, Oracle, SAP, Samsung, Huawei) whose gear MSTI integrates and resells.
Indonet's own sizing of the Indonesian ICT market MSTI competes in — ~USD46.6bn in 2025, dominated by enterprise-scale spending (71.8% share) led by the multinational vendors MSTI integrates and resells, with cloud the single largest technology segment and banking/financial services the biggest spending vertical.
Mordor Intelligence estimated the Indonesian ICT market to reach USD46.57 billion (approximately Rp753.31 trillion) in 2025, underscoring ICT’s role as the backbone of cross-sector digital transformation—particularly within the Banking and Financial Services Industry (BFSI), which accounted for 24.5% of national ICT spending. Indonesia’s ICT market continued to be dominated by enterprise-scale companies, representing a 71.8% market share, and was largely led by multinational corporations such as IBM, Oracle, SAP, Samsung, and Huawei. From a technological perspective, cloud computing represented the largest segment of Indonesia’s ICT market in 2025, contributing 39% of the total market share
p. 62 · Read in context →
The two infrastructure segments MSTI targets, sized by a peer: Indonet puts Indonesia's 2025 cloud market at ~USD2.44bn and its data-center market at ~USD1.61bn, and cites a large untapped cloud-migration pipeline — a read on the demand pool MSTI is also selling into.
The value of Indonesia’s cloud market in 2025 was estimated at approximately USD2.44 billion. […] Furthermore, 73% of companies that had not yet adopted cloud solutions indicated plans to migrate to cloud-based infrastructure within the next two years […] In 2025, the domestic data center market was estimated to reach approximately USD1.61 billion, with the IT and telecommunications sector accounting for 51.10% of total market share during the year
p. 63 · Read in context →
Indonet's candid account of the cloud fight — competition on features, pricing and ecosystem maturity, met by leaning on Alibaba Cloud and BytePlus partnerships for AI workloads. This is the same cloud-infrastructure arena MSTI plays in, from a rival's vantage.
The Cloud segment remained challenging, facing competition in features, pricing, and ecosystem maturity. We strengthened partnerships with Alibaba Cloud and BytePlus, focusing on AI-driven workloads and sectorspecific solutions in media, education, and digital platforms.
p. 20 · Read in context →
More peer documents
EDGE_annual_report_FY2024 — 256 pages · FY2024 management report frames an intensifying data-center competitive landscape (p.27, p.78) and gives the FY2024/2023 revenue split by segment — cloud, data center, connectivity, managed services (p.237) — a like-for-like structural comparison against MSTI's mix. · Open →
GLVA_annual_report_FY2023 — 2 pages · PT Galva Technologies (GLVA) FY2023 filing — an Indonesian IT/electronics distributor in the adjacent hardware channel; the supplied document is only a two-page IDX submission cover letter, so it carries no substantive competitive disclosure to feature. · Open →
Source: S&P Capital IQ consensus via Xpressfeed · Generated 2026-07-22.
S&P Capital IQ consensus for PT Mastersystem Infotama is a thin tape — one to two analysts on most lines, all figures in Indonesian rupiah. Over the past three-to-six months the forward marks have been cut: FY2027 revenue is down roughly 11% from its 180-day level and EPS has been trimmed alongside it. The underlying estimates still model steady mid-single-digit revenue growth with profitability compounding a little faster. The three covering analysts remain uniformly constructive — two Buy and one Outperform.
Coverage is thin: one-to-two analysts per line and no captured beat/miss history
FY2025 headline lines carry a single estimate and the forward years just two; FY2029 has only cash-flow marks. With an empty beat/miss record, there is no captured history to judge guidance behavior, so these consensus points should be read as indicative rather than firm.
FY2027 revenue consensus cut ~11% over 180 days, with EPS trimmed alongside
The FY2027 and FY2028 revenue and EPS marks have all stepped down over the past three-to-six months and none has recovered. The downgrade is broad-based rather than a single-metric adjustment.
Currency: IDR · Scale: money in millions, billions, absolute · Point-in-time consensus; Δ90d is Now versus 90d.
| Metric | FY | 180d | 90d | 30d | Now | Δ90d |
|---|---|---|---|---|---|---|
| Revenue | FY2027 | IDR 6,828 | IDR 6,550 | IDR 6,046 | IDR 6,046 | -7.7% |
| Revenue | FY2028 | — | IDR 6,774 | IDR 6,413 | IDR 6,413 | -5.3% |
| EPS (normalized) | FY2027 | IDR 213.0 | IDR 214.3 | IDR 199.3 | IDR 199.3 | -7.0% |
| EPS (normalized) | FY2028 | — | IDR 229.2 | IDR 210.1 | IDR 210.1 | -8.3% |
Consensus still models steady mid-single-digit revenue growth with EBITDA outgrowing the top line
EBITDA and normalized EPS are modeled to grow a few points faster than the roughly 6% top line, consistent with modest margin expansion. Every row here rests on just one or two analysts.
Currency: IDR · Scale: money in millions, billions, absolute · YoY uses the prior fiscal year from the feed; analyst count and range use the first displayed period.
| Metric | FY2026E | FY2027E | FY2028E | YoY | Analysts | Low / high |
|---|---|---|---|---|---|---|
| Revenue | IDR 5,704 | IDR 6,046 | IDR 6,413 | +4.6% | 2 | IDR 5,600 / IDR 5,807 |
| EBITDA | IDR 787.7 | IDR 856.7 | IDR 927.4 | +6.6% | 2 | IDR 761.4 / IDR 814.0 |
| EPS (normalized) | IDR 183.2 | IDR 199.3 | IDR 210.1 | +4.8% | 2 | IDR 173.0 / IDR 193.5 |
Dividend and free cash flow both modeled higher across the forecast
Consensus, mostly a single analyst on these lines, has the dividend rising each year and free cash flow ramping through the window. Treat this as a directional single-source read, not a consensus range.
Currency: IDR · Scale: money in millions, billions, absolute · YoY uses the prior fiscal year from the feed; analyst count and range use the first displayed period.
| Metric | FY2026E | FY2027E | FY2028E | YoY | Analysts | Low / high |
|---|---|---|---|---|---|---|
| Dividend per share | IDR 121.9 | IDR 128.7 | IDR 140.5 | +27.0% | — | — |
| Free cash flow | IDR 299.90bn | IDR 532.00bn | IDR 566.60bn | +159.7% | — | — |
| Cash from operations | IDR 493.9 | IDR 665.5 | IDR 705.3 | +166.3% | — | — |
Three analysts, all positive: two Buy and one Outperform, targets IDR 1,600-2,000
The bullish tilt is unanimous even as the forward estimates behind it have been trimmed.
Currency: IDR · Scale: money in millions, billions, absolute · Analyst counts shown explicitly.
| Street view | Reading | Analysts |
|---|---|---|
| Recommendation mix | Buy 2, Outperform 1, Hold 0, Underperform 0, Sell 0 | 3 |
| Consensus score | 1.33 | 3 |
| Target price | mean IDR 1,767; median IDR 1,700; high IDR 2,000; low IDR 1,600 | 3 |
The Baseline
PT Mastersystem Infotama (IDX: MSTI) sells and integrates the hardware, software, and maintenance that run the data centres of Indonesia's banks and telecoms. It is a 31-year-old, founder-controlled business that earns about 24% on equity, holds roughly Rp1.6 trillion of net cash, pays out most of its profit, and trades near eight times earnings — yet its revenue growth slowed sharply from +27.6% in FY2024 to +1.8% in FY2025. This chapter orients a cold reader and sets the question the report exists to answer.
What the company does
Mastersystem is an information- and communication-technology (ICT) system integrator. Founded in 1994, it plans, designs, installs, and maintains enterprise IT infrastructure — data centre and cloud, enterprise networking, cybersecurity, collaboration, and data/AI — reselling and configuring the products of principals such as Cisco, Dell, and Lenovo for large Indonesian institutions. It is, in plain terms, the contractor a bank hires to build and run the plumbing behind its digital services.
The revenue splits four ways, and the mix is moving. In FY2025 hardware was 49.7% of sales, software 31.1%, maintenance 14.5%, and installation 4.7% [1]. A year earlier hardware was 58.8% and software 22.8%: in a single year hardware revenue fell 14% while software rose 39% [2]. The flat FY2025 headline masks a shift toward software and recurring maintenance.
Source: FY2025 Annual Report, Note 17 Net Sales [3].
The customer base is narrow and skewed to regulated institutions. In FY2025 a single customer — Bank Indonesia, the central bank — accounted for Rp669.5 billion, or 12.3% of net sales; in FY2024 two customers each exceeded 10%, PT Bank Syariah Indonesia and telecom carrier PT Aplikanusa Lintasarta [4]. The largest account rotates year to year, but financial services and telecommunications dominate the book, and that concentration is both the growth engine and the main source of the revenue lumpiness examined below.
Scale and profitability
Mastersystem is a small company by market value but a consistently profitable one. FY2025 revenue was Rp5.45 trillion and net profit Rp549.1 billion, for a 10.1% net margin [5]. Return on equity has stayed above 20% for five straight years — about 24% in FY2025 — on a gross margin that has held near 18% [6].
FY2025 revenue
FY2025 net profit
Net margin
Return on equity
Figures in Rp bn. Source: FY2025 audited statements; ROE derived from reported net profit and equity [7].
The growth record is where the story turns. Revenue compounded at roughly 15% a year from FY2021 to FY2025, but the path was not smooth: growth accelerated to +27.6% in FY2024, then almost stopped at +1.8% in FY2025. Net profit followed a milder version of the same curve, rising 18.5% in FY2024 and 3.5% in FY2025 [8].
Source: FY2025 audited statements (FY2024–FY2025) and prior-year filings [9].
Source: derived from reported revenue, FY2021–FY2025 filings [10].
The balance sheet
For an investor who wants the chance of bankruptcy near zero, the balance sheet is the headline. At end-2025 Mastersystem held Rp1.63 trillion of cash against Rp17.6 billion of bank borrowings — net cash of roughly Rp1.6 trillion, or about 38% of the current market value [11]. Interest-bearing debt is trivial even after adding Rp82 billion of lease liabilities; equity of Rp2.29 trillion funds a business whose only sizeable fixed cost is people, with property and equipment of just Rp219 billion [12]. The model is asset-light: capital expenditure has run below 1% of revenue, and the working-capital swing — inventory and receivables against customer advances and supplier payables — drives cash flow more than any capex cycle.
That cash also funds a large distribution. For FY2024 the company paid a cash dividend of Rp118 per share, about 70% of that year's profit [13]. Against the current Rp1,350 share price that is a trailing yield near 8.7% — a return paid while the growth question resolves, though one dependent on the payout continuing.
Ownership and alignment
Control sits with three individuals, all on the boards, who together hold about 85% of the shares: co-founder and President Director Eddy Anthony (28.75%), President Commissioner Jupri Wijaya (28.75%), and co-founder and Vice-President Director Joko Gunawan (27.48%). The public float is the 15.02% sold at the IPO [14].
Source: FY2024 Annual Report, Shareholder Composition (unchanged through 31 Dec 2024) [15].
This is skin in the game of an unusual degree, and it cuts both ways. Insiders' wealth is overwhelmingly tied to the same shares outside investors own, and the fat dividend flows disproportionately to them — an alignment a value investor prizes. But the thin float means minority holders have no practical vote, the board carries no independent director on the executive tier (independence rests with a single independent commissioner), and there is no takeover option that does not run through the founders. The later governance chapter will test how that concentration has actually been exercised.
The stock and the setup
Mastersystem listed on 8 November 2023, issuing 470.8 million new shares at Rp1,355 [16]. Roughly two and a half years later the shares change hands at about Rp1,350 — essentially flat with the offer price, and below it in real terms, even though profit has risen about 23% since the FY2023 result. Over the past year the price ranged from Rp1,155 to Rp1,675. Earnings up, price still, is a de-rating: the multiple has compressed as the market has watched growth stall.
Market cap (Rp bn)
Trailing P/E
Net cash (Rp bn)
Dividend yield
Market cap at Rp1,350 close (22 Jul 2026) on 3,139,416,200 shares; net cash and earnings from FY2025 audited statements [17].
Strip out the net cash and the operating business is valued at roughly Rp2.6 trillion, under five times FY2025 earnings and about 3.6 times EBITDA, for a company that has earned 20%-plus returns on equity through the cycle. A consensus of three analysts rates the stock a Strong Buy with a mean price target of Rp1,767 (about +31%), and forecasts modest growth ahead — revenue of roughly Rp5.7 trillion in FY2026 (source: stockanalysis.com, aggregating S&P Global data). At Rp1,350, that consensus ~Rp5.70 trillion FY2026 revenue (+4.5%) and the Rp1,767 mean target imply a modest reset off the FY2025 stall, not a decline.
The question this report answers
Mastersystem presents a specific tension. On one side: a debt-free, founder-owned business earning ~24% on equity, sitting on net cash worth almost 40% of its market value, paying an ~8.7% dividend, and trading under five times earnings once that cash is removed — a margin-of-safety profile with the balance-sheet risk that ends most value theses badly all but absent. On the other: revenue that stopped growing in FY2025, a book concentrated in the lumpy, project-driven IT budgets of Indonesian banks and telecoms, and a 15% float that leaves outside holders as passengers.
The report's through-line is therefore this: is MSTI's FY2025 growth stall a cyclical pause in a business still structurally compounding at a low-teens rate, or the arrival of a mature ceiling — and does the net-cash balance sheet and 85% founder ownership provide enough margin of safety to own it while that question resolves? The chapters that follow take up the pieces this one only names — the durability of the growth engine and the FY2025 slowdown, the cash-conversion and accounting quality behind the reported returns, the moat and customer concentration, how the founders have used the capital, and what the price implies at different answers.
Financials and Estimates
Over FY2021–FY2025, MSTI grew revenue at a 15% compound rate and net income at 14%, earning roughly 24% on equity with almost no debt. FY2025 broke that trend: revenue rose 1.7% against management's own double-digit target, as a non-recurring 2024 "AI Factory" project rolled off — and the growth that remained came almost entirely from the wrong line. MSTI's growth is concentrated in its lowest-margin line: software license resale at ~8% gross margin rose 39% in FY2025 and 26.8% in Q1 FY2026 — climbing from 22.8% to 38.6% of sales — as hardware fell 14% then 21%, so the surge added almost nothing to profit (blended gross profit +2.0%, gross margin flat ~18%). The counter runs the other way too: hardware's own product margin actually improved (13.4%→15.9%) and the recurring maintenance line grew 13.5%, so a genuine shift toward MSTI's own managed services could still turn the mix into a margin story over time. Management and analysts now guide single-digit growth through FY2027.
The five-year record
For four years MSTI compounded steadily. Revenue climbed from Rp3.11T in FY2021 to Rp5.45T in FY2025 — a 15.1% annual rate that management leads with in its own investor materials [1]. Net income rose from Rp327bn to Rp549bn over the same span, a 13.8% compound rate, and earnings before interest, tax, depreciation and amortisation grew at 12.3% [2]. This is an asset-light distributor-integrator earning mid-20s returns on equity — the balance sheet and ownership are covered in The Baseline.
FY2025 Revenue (Rp bn)
FY2025 Net Income (Rp bn)
Return on Equity
Revenue CAGR FY21–25
Sources: FY2025 net sales per the FY2025 Annual Report MD&A [3] and net income [4]; revenue CAGR per Public Expose 2025 [5] and ROE per the same deck [6].
Sources: FY2023–FY2025 per FY2025 Annual Report MD&A [7] and net income [8]; FY2021–FY2022 revenue per the 2023 IPO Prospectus [9]; FY2021–FY2022 net income per Public Expose 2025 [10].
The full profit-and-loss record shows the compounding — and where it stopped. Two things are worth holding onto before FY2025. First, revenue growth accelerated into FY2024 (+27.6%), the opposite of a business running out of room. Second, margins were already drifting down: operating margin peaked at 15.4% in FY2022 and has since settled near 12%, and net margin has hovered around 10%.
Source: revenue, operating income, net income and EPS from the FY2025 Annual Report MD&A and Note 24 [11]; margins and growth rates derived from reported financials, FY2021–FY2025.
FY2025: a normalization, on management's own account
The stall has an explanation, and it comes from management directly. In the annual report's target-versus-realization disclosure, the board attributes FY2025's flat top line to "the impact of a high comparative base in the previous year, which was supported by the non-recurring contribution of the AI Factory project in 2024" [12]. Having entered 2025 with a double-digit net-sales growth target, the company delivered a "low single-digit level, with net sales increasing by 1.74%," which it frames as "a normalization phase following the high growth base in 2024" [13].
That is a candid admission: the FY2024 acceleration this report opened with was partly a one-off, and FY2025 is what the base business looks like without it. On this account the stall is neither a clean cyclical dip nor an obvious ceiling, but a return to trend after a project-driven spike.
The product-line detail supports the story. FY2025's Rp93bn of net revenue growth is the residue of two large, nearly offsetting moves: hardware fell Rp442bn (-14.0%) as the 2024 project rolled off, while software rose Rp472bn (+38.5%). Maintenance — the recurring line — grew a healthy 13.5% [14].
Source: FY2025 Annual Report, MD&A segment table and Note 17 Net Sales [15], [16].
Underneath the segments, the demand base is concentrated and rotates. Bank Indonesia was the only customer above 10% of sales in FY2025 at Rp670bn (12.3%); a year earlier it was Bank Syariah Indonesia and Lintasarta [17]. Financial-services and telecommunications customers together supply 73%–81% of revenue [18]. A book that turns over its largest account each year is inherently lumpy — the AI Factory project is one instance of a recurring pattern, not a one-time anomaly.
Why the mix shift did not lift margins
The intuitive read of "software up 39%, now 31% of revenue" is that MSTI is drifting toward higher-margin work. The cost detail says otherwise. In MSTI's accounts, the software line is low-margin third-party license resale, not proprietary product: its FY2025 cost of sales was Rp1,560bn against Rp1,696bn of revenue — a gross margin of roughly 8%, lower than hardware's 16% [19], [20]. The genuinely high-margin work is services: the maintenance and installation lines carried about Rp1,047bn of revenue against Rp312bn of directly attributed service cost, though some shared costs (depreciation, freight) are not allocated by line.
Source: derived from FY2025 Annual Report Note 17 Net Sales and Note 18 Cost of Sales by product line [21], [22].
So the mix shift is real but it is not a quality upgrade. Because the growing line earns the thinnest product margin, blended gross profit rose only 2.0% — from Rp964bn to Rp984bn — even as the composition re-weighted sharply, and gross margin held near 18% [23]. That 18% is itself down from about 20.8% in FY2023, and operating margin has compressed from 15.4% in FY2022 to 12.2%. The margin data cuts against reading the software surge as a mix upgrade: the durable margin engine is the maintenance/services book, which is growing double digits but is a smaller line. What would change this read is evidence that the "software" line is shifting toward MSTI's own managed-service subscriptions — a strategy the company flags but does not yet quantify.
Source: derived from reported financials, FY2021–FY2025 (revenue and operating/net income per FY2025 Annual Report MD&A) [24].
Net income and per share
There is a wedge between the company's profit growth and what a shareholder actually earned per share, and it matters for reading the record. In FY2024 net income rose 18.5%, but earnings per share rose only 3.6% — from Rp163.0 to Rp169.0. The gap is the IPO: the weighted-average share count jumped from 2.75bn in FY2023 to 3.14bn in FY2024 as the 470.8m shares issued in November 2023 counted for a full year [25], [26].
The dilution is now behind the numbers. With the share count essentially fixed at 3.14bn, FY2025 EPS of Rp174.9 grew 3.5% — in line with net income, not below it [27]. Going forward, corporate profit growth should translate roughly one-for-one into per-share growth, save for a small MESOP option pool (16.0m shares, about 0.5% of the base). The practical implication: the five-year EPS CAGR of about 5% understates the underlying business, which compounded profit at 14% — most of the difference is the one-time IPO dilution rather than weak earnings.
One cash-flow note bears on earnings quality, though it deserves its own treatment: operating cash flow fell 23% in FY2025 to Rp697bn, mainly on a 6% drop in customer receipts [28]. Reconciling that against reported profit — and the swing from Rp243bn (FY2023) to Rp905bn (FY2024) to Rp697bn (FY2025) — is a working-capital question left for a dedicated cash-conversion chapter.
What the forward estimates imply
Management and the market broadly agree on the near term, and neither calls for a return to the old trajectory. The board's own FY2026 guidance is explicit: "a single digit growth projection" [29]. Consensus lines up just above that: the three analysts covering the stock (compiled by stockanalysis.com) model revenue of Rp5.70T in FY2026 (+4.5%) and Rp6.05T in FY2027 (+6.1%), with EPS of Rp183.2 and Rp199.3 — a modest reacceleration from FY2025, but a fraction of the 15% four-year history.
Source: reported revenue FY2021–FY2025 per the FY2025 Annual Report and 2023 IPO Prospectus [30], [31]; FY2026–FY2027 consensus of three analysts as compiled by stockanalysis.com.
FY2026e Revenue (Rp bn)
FY2026e EPS (Rp)
FY2027e Revenue (Rp bn)
FY2027e EPS (Rp)
Source: consensus analyst estimates (three analysts) as compiled by stockanalysis.com; company FY2026 guidance of single-digit growth per the FY2025 Annual Report [32].
At the recent Rp1,350 price, FY2026 consensus EPS of Rp183 puts the stock on about 7.4 times forward earnings; the mean analyst target of Rp1,767 implies roughly 9.6 times — a re-rating of a cheap, cash-rich stock rather than a bet on renewed double-digit growth. The forward numbers point the same way without settling the question. The near-term consensus leans toward the lower-plateau read: not decline, but growth several points below the FY2021–FY2024 pace. What would push the read back toward "cyclical pause" is a new project cycle — the company points to cybersecurity, cloud and managed services as the demand drivers behind its 2026 outlook [33] — the strength of those tailwinds is the subject of a later chapter.
First FY2026 Quarter
MSTI's first FY2026 quarter is the first forward test of the valuation case, and it cuts both ways. After crediting ~Rp1.5T of net cash (about 36% of market value), MSTI's operating business trades at only ~4.9x FY2025 earnings and ~4.1x operating profit — but that trailing base is already contracting, with Q1 FY2026 net sales down 8.0% to Rp1,096.0bn and net profit down 7.5% to Rp106.6bn. [1][2]
The forward arithmetic is what the price turns on: a ~4.9x/4.1x multiple struck on a base falling ~8% carries a higher forward multiple than the trailing snapshot implies, and consensus FY2026 revenue of ~Rp5.70 trillion (+4.5%) now needs Q2–Q4 to grow ~8% to reach it — about a sixteen-point swing from the pace just set. The counter runs through the same numbers: hardware's fall is the continued unwind of the one-off FY2024 AI Factory boom — still above Q1 FY2023's Rp333.6bn — software's compounding is uninterrupted, and margins held, which reads as cyclical normalisation rather than a proven ceiling. The valuation stake this quarter sets is carried in What the Price Implies.
Q1 Net Sales (Rp bn)
▼ -8.0% YoY
Q1 Net Profit (Rp bn)
▼ -7.5% YoY
Gross Margin
▼ -0.5% YoY chg
Net Cash (Rp bn)
Sources: Q1 FY2026 net sales and gross profit [3][4]; net cash derived from cash of Rp1,499.2bn less Rp91.9bn total borrowings [5].
The stall deepened into a decline
The quarter sits against the trajectory earlier chapters established. Revenue grew 27.6% in FY2024 on a hardware surge, then decelerated to 1.7% in FY2025 as that surge unwound (Financials and Estimates). The FY2025 total was Rp5,454.7 billion, split Rp2,711.1bn hardware, Rp1,696.4bn software, Rp792.1bn maintenance and Rp255.2bn installation [6]. Q1 FY2026 is the first period that moved the run-rate below the prior year outright: Rp1,096.0bn against Rp1,191.7bn a year earlier [7].
Source: FY2024/FY2025 from the annual net sales note [8]; Q1 FY2026 from the interim net sales note [9]. Annual and quarterly growth rates shown together; the last bar is a single quarter.
One quarter is a partial read, and this is a project-weighted business where large orders land unevenly through the year, so a single soft quarter is not the year. But the direction is the point: three data points now run 27.6%, then 1.7%, then –8.0%, and the newest is the weakest.
Hardware unwinds, software compounds
The composition tells the more useful story. Hardware — the line that drove the FY2024 boom — fell 21.0% in the quarter, to Rp466.3bn from Rp590.2bn, its second consecutive Q1 decline of roughly a fifth from the FY2024 peak of Rp747.0bn [10]. Software grew 26.8%, to Rp423.0bn from Rp333.5bn, and now sits within Rp43bn of hardware — 38.6% of net sales against 28.0% a year earlier [11]. Maintenance fell 16.3% and installation fell 38.8% [12]. Software was the only line that grew; it could not offset the rest.
Source: interim net sales notes, Q1 FY2024–Q1 FY2026 filings; the FY2024 figures also appear as the prior-year comparative in the Q1 FY2025 note [13].
Read across four years, the two lines are moving in opposite directions. Hardware jumped to Rp747.0bn in Q1 FY2024 — the "AI Factory" cycle described in Financials and Estimates — and has retraced two years running to Rp466.3bn, still above its Q1 FY2023 level of Rp333.6bn. That shape is consistent with the unwind of an abnormal one-off order rather than a collapse in underlying demand. Software, by contrast, has risen every year, from Rp150.8bn in Q1 FY2023 to Rp423.0bn, roughly a tripling. The structural shift the company has narrated is visible in the numbers; what it has not yet done is carry the total.
Mix richer in software, not in margin
The mix shift toward software does not lift profitability. MSTI's growth is concentrated in its lowest-margin line: software license resale at ~8% gross margin rose 39% in FY2025 and 26.8% in Q1 FY2026 — climbing from 22.8% to 38.6% of sales — as hardware fell 14% then 21%, so the surge added almost nothing to profit (blended gross profit +2.0%, gross margin flat ~18%). Inside the quarter the same mechanism holds: gross profit was Rp204.1bn on Rp1,096.0bn of sales — an 18.6% gross margin, down slightly from 19.1% a year earlier [14]. Within the quarter, hardware carried a gross margin near 16.2% and software near 9.8%, computed from the net sales and cost-of-sales notes [15]. So each point of mix that moves from hardware to software trims the blended rate — the same dynamic Moat and Market identified, now confirmed in FY2026 actuals.
Source: software share derived from the net sales notes — FY2024/FY2025 annual [16], Q1 FY2026 interim [17].
Net profit held its shape better than revenue: down 7.5%, roughly in line with sales, leaving the net margin at 9.7% versus 9.7% a year earlier [18]. Operating costs fell with the top line — general and administrative salaries and long-term employee benefits both declined year on year [19]. The business is defending its margin on the way down, but it is defending a smaller base.
The balance sheet held
Nothing in the quarter touches the report's margin-of-safety anchor. Equity rose to Rp2,402.0bn, and the company carried Rp1,499.2bn of cash against Rp91.9bn of total borrowings including leases — net cash of about Rp1.4 trillion, still roughly a third of the market value [20][21]. Cash fell Rp134.2bn over the quarter, in line with the Rp16/share interim dividend paid in December carrying into the period and a seasonal working-capital build [22].
Two working-capital details are worth flagging. Trade receivables rose again, to Rp892.8bn from Rp788.2bn at year-end — up 13.3% in a quarter while sales fell — extending the receivables build Cash Conversion traced through FY2025 [23]. And no single customer exceeded 10% of sales this quarter, where PT Telekomunikasi Selular had been 11.6% (Rp138.4bn) a year earlier [24]. A large telco order rolling off is part of why the quarter is soft — a reminder that in a project business, one account swings a quarter.
Cyclical unwind or a lower run-rate
The first FY2026 quarter tilts the cyclical-versus-ceiling read, without settling it. On the ceiling side: the top line has now printed below the prior year, maintenance and installation joined hardware in decline, and the one growing line earns half the margin of the one shrinking. On the cyclical side: hardware's fall is the continued unwind of a known one-off boom, not a demand cliff; software's climb is real and uninterrupted; and margins held. The evidence points to a top line that is still contracting as the FY2024 hardware cycle washes out — but the composition keeps the structural question open rather than closing it against the business.
The near-term arithmetic, laid out at the top of this chapter, leaves the remaining three quarters needing roughly 8% growth to hit the consensus Rp5.70 trillion — a wide gap to the pace just set. The next hard read is close: the H1 FY2026 statements are due 29 July 2026, one week out. Hardware stabilising and the blended gross margin turning up from 18.6% would support the cyclical case; a second quarter tracking Q1, with software still diluting margin, would move the read toward a lower structural run-rate — the outcome that most matters for the operating multiple in What the Price Implies.
Cash Conversion
Over the five years to FY2025, MSTI's operating cash flow equals about 98% of reported net profit, and capital spending runs below 1% of sales — so the earnings are backed by cash and the balance sheet's ~Rp1.6T of net cash is real and low-cost. That underwrites the near-zero-bankruptcy footing the case leans on. The catch: any single year's cash flow is a poor gauge. A project-delivery book and a chronic tax-refund cycle make it swing violently.
Operating Cash / Net Income (FY21–25)
Free Cash / Net Income (FY21–25)
Capex / Sales (FY2025)
Net Cash (Rp bn)
Sources: cumulative operating cash flow and capex from the FY2025 and FY2023 cash-flow statements [1] [2]; net cash and net income from the FY2025 statement of financial position [3].
Profit backed by cash, over a full cycle
The reassuring number for a margin-of-safety reader is cumulative. Add up five years of reported profit (FY2021–FY2025) and it comes to about Rp2.25T; add up five years of operating cash flow and it comes to about Rp2.20T [4] [5]. The business converts roughly 98 cents of every reported rupiah of profit into operating cash over the cycle. Because it is asset-light — capex was Rp31.1bn in FY2025 against Rp5.45T of sales, or 0.6% [6] — free cash flow tracks close behind, at about 92% of net income cumulatively.
Sources: FY2025 cash-flow statement for FY2024–FY2025 operating cash flow [7]; FY2023 MD&A cash-flow table for FY2021–FY2023 [8]; net income from the statements of profit or loss, as reported [9].
The chart also shows the problem with reading any single bar. Net income (the grey series) climbs in an almost straight line from Rp327bn to Rp549bn. Operating cash (the blue series) does nothing of the sort.
Why one year's cash flow misleads
Year by year, the conversion ratio swings from a third of profit to nearly double it.
Source: operating cash flow and net income per the FY2023 and FY2025 cash-flow statements and profit-or-loss statements [10] [11].
FY2022 converted 32% of profit to cash; FY2024 converted 171%. The 2024 figure — operating cash flow of Rp905bn against Rp530bn of profit — is not a sign of superior earnings quality any more than 2022's Rp129bn was a sign of deterioration. Two structural features drive the swing, and neither has much to do with how the business performed in a given twelve months.
The first is the shape of the book. MSTI recognises revenue as it delivers and installs multi-quarter infrastructure projects, so the timing of large deliveries and their collections straddles year-ends. That moves receivables, inventory and supplier payables in big steps. Working capital is also part-funded by customers: MSTI carried Rp128.5bn of sales advances (contract liabilities — cash collected ahead of delivery) at end-2025 [12].
The second is a tax quirk that is large enough to dominate the cash flow on its own.
The VAT refund cycle
As a reseller, MSTI pays value-added tax on the hardware and software it buys from principals and distributors, but a large share of its sales go to customers — banks, telcos and government-linked bodies — where output VAT is collected differently. The result is a structural overpayment: MSTI is chronically owed VAT by the tax office, files for a refund, and waits. The refunds are real, but they arrive one to two years after the period they relate to, in lumps of Rp60bn–Rp130bn [13].
Source: FY2025 Annual Report, Note 22 — Notice of Tax Assessment [14].
This is what flattered FY2024 and why FY2025 looks weaker than it is. In calendar 2024 the company collected two years' worth of refunds at once — the December-2021 overpayment (Rp63.3bn, received February 2024) and the December-2022 overpayment (Rp132.9bn, received May 2024) — for a combined Rp196.0bn VAT inflow that year [15]. FY2025 received one refund — the December-2023 overpayment of Rp130.6bn, collected in October 2025 [16]. The Rp65bn swing in refund timing is a bookkeeping artefact, not a change in the business. The flip side is a permanent drag on the balance sheet: MSTI carried Rp222.4bn of prepaid taxes at end-2025, part of it VAT still awaiting assessment [17].
Decomposing the FY2025 decline
Operating cash flow fell 23% in FY2025, from Rp905bn to Rp697bn [18]. The Rp208bn drop breaks into three pieces, and none of them is earnings weakness — profit actually rose 3.5% that year.
Source: derived from the FY2025 and FY2024 columns of the FY2025 cash-flow statement [19].
Roughly half the decline (Rp99bn) is tax and VAT timing — the smaller refund plus higher income tax paid. The rest (Rp110bn) is lower cash generated from operations before tax, which in turn reflects a Rp344bn drop in cash received from customers, from Rp5.59T to Rp5.25T, even as reported sales rose [20]. Cash lagged sales because more of FY2025's revenue was still sitting in receivables at year-end.
What sits between profit and cash now
The honest counterweight to the "cash-backed profit" story is where the FY2025 profit currently rests. Trade receivables jumped 37%, from Rp574bn to Rp788bn, against sales that were essentially flat — pushing days-sales-outstanding from 39 to 53 days [21]. Add the Rp222bn of prepaid taxes, and a meaningful and growing slice of reported earnings is a claim on customers and the tax office rather than money in the bank.
Source: FY2025 Annual Report, Statement of Financial Position [22].
That said, the net working-capital cycle actually tightened in FY2025, not loosened: the receivables build was matched by a Rp214bn increase in supplier payables and a Rp98bn drawdown of inventory, so the cash conversion cycle shortened from about 47 to 35 days [23]. The receivables spike reads more like year-end delivery timing than a collection problem — but it is the line to watch. If DSO keeps climbing while sales stay flat, reported profit would increasingly overstate the cash the business can actually distribute.
Watch item: trade receivables rose 37% in FY2025 on flat sales, lifting days-sales-outstanding from 39 to 53. A further rise without matching cash collection would mean reported earnings are running ahead of cash.
On the read that matters most to this investor, the evidence is reassuring. The Rp1.6T of net cash is genuine and low-cost, with Rp43bn formally restricted (pledged against bank guarantees) and a further undisclosed portion of current accounts pledged — detailed in Facilities and Collateral — yet it dwarfs the Rp17.6bn of bank debt several times over [24]. Current assets cover current liabilities 3.1 times. The dividend is funded from real cash — Rp421bn paid in FY2025 against Rp666bn of free cash flow [25] — though in a low-conversion year like FY2022, when operating cash was only Rp129bn, a payout of that size would have to come out of the cash pile rather than the year's earnings. With net cash near 38% of market value and no refinancing risk, the balance sheet can absorb several such years without strain.
The conclusion is that MSTI's cash generation is lumpy, not weak. Profit turns into cash across the cycle; it just does so on the tax office's timetable and the delivery calendar's, not the income statement's. For a reader whose first requirement is that the chance of a wipeout be near zero, the earnings quality clears the bar — provided receivables and the refund backlog are tracked as they build, not after.
MSTI's net-cash balance sheet is real, but it is neither idle nor unencumbered. At end-FY2025 drawn bank debt was just Rp17.6bn against Rp1,627bn of cash. The company runs instead on a lattice of mostly-undrawn credit lines — working-capital revolvers, a new supplier-financing facility, and the bank-guarantee lines it must post to win bank and government projects. Cash, receivables, inventory and the head-office building are all pledged against them. There is no litigation and no covenant breach.
The drawn debt is close to nothing
Earlier chapters described a fortress balance sheet, and at the net level it is one. What the headline understates is how little of it is borrowed. At 31 December 2025 the company's total drawn bank loans were Rp17.6bn — Rp7.3bn of short-term facility at Bank Mandiri and Rp10.3bn of an OCBC NISP term loan — down from Rp58.6bn a year earlier as it repaid short-term lines [1]. Against Rp1,627bn of cash and equivalents [2], that leaves net cash of roughly Rp1,610bn. The interest cost is a rounding error: bank-loan interest was Rp330m for the whole of the first quarter of FY2026, on a book that had shrunk again to Rp15.7bn by 31 March 2026 [3].
Cash & equivalents (Rp bn)
Drawn bank debt (Rp bn)
Net cash (Rp bn)
Restricted cash (Rp bn)
Source: FY2025 Annual Report, Note 10 Bank Loans [4] and Note 33 Financial Instruments [5]; net cash derived as cash less drawn bank loans.
A lattice of standby lines it mostly does not use
The small drawn balance sits on top of a much larger stack of committed facilities that stay almost entirely unused. The company holds a Rp100bn working-capital revolver at BCA, a Rp67.5bn bank-guarantee line at Permata, a Rp50bn supplier-financing facility at UOB, and a Rp100bn term-loan line at OCBC NISP, alongside a US-dollar combined-trade facility at OCBC with a USD18.995m ceiling (itself carrying a USD6.0m payment-guarantee sub-limit and a USD8.0m foreign-exchange line) [6]. At year-end the BCA revolver and the UOB line were both undrawn [7][8].
Sources: FY2025 Annual Report, Note 10 Bank Loans — OCBC NISP [9], BCA [10], Permata [11] and UOB [12]; Mandiri and OCBC drawn balances from Note 10 [13]. The US-dollar OCBC ceiling is described in the text; the table lists the Rupiah facilities.
The read here is straightforward: MSTI funds its working capital from its own cash and from supplier trade credit, not from banks, and keeps the lines mainly as standby capacity and as the plumbing for guarantees. That is a genuine strength — a reseller that carries a Rp788bn receivable book without leaning on debt has real balance-sheet slack. It also means the drawn figure tells you little about the model; the facilities do.
Bank guarantees are the operationally load-bearing part
The line that matters most is the one that is not a loan at all. To bid for and deliver projects to banks and government bodies — Bank Indonesia and Telkomsel among the rotating large accounts named in earlier chapters — a system integrator must post bid and performance bonds. MSTI meets that with the Permata Rp67.5bn bank-guarantee facility [14] and the OCBC USD6.0m payment-guarantee sub-limit [15], plus guarantees issued through BNI and Mandiri against ongoing project work.
That machinery reaches back into the cash pile. A portion of the current-account balances at OCBC and Permata is pledged as collateral for the foreign-exchange and bank-guarantee facilities, while cash and time deposits at BNI and Mandiri are held as collateral for guarantees the banks have issued on projects still in progress [16]. The visible on-balance-sheet cost of this is the restricted-cash line, which rose 57% to Rp43.2bn from Rp27.6bn as the project book grew [17]. The pledge of ordinary current-account funds is disclosed but not quantified, so the true encumbrance is somewhat larger than Rp43bn — the point an earlier chapter's "only Rp43bn pledged" reading understates.
None of this makes the balance sheet weak. But it qualifies the word unrestricted: this is cash that partly exists to backstop the guarantees the business needs to trade, and it grows with the order book rather than being fully available for distribution.
What secures the facilities
The collateral net is wider than the cash. The BCA facility alone is secured against cash held at the bank, trade receivables, inventory, and the company's own office floor — Sudirman 7.8 Tower 1, 25th Floor [18]. Receivables are separately pledged for the short- and long-term bank loans [19], and property and equipment — including the building — are pledged for the loans and lease liabilities [20]. For an "asset-light" business, essentially every operating asset it owns is committed as security against a set of facilities it barely draws. The encumbrance is broad but shallow: broad because it touches every asset class, shallow because the obligations behind it are tiny relative to the assets.
The supplier-financing line is a signal about the hardware supply chain
The newest facility is the most revealing. In February 2025 MSTI opened a Rp50bn Omnibus Supplier Financing line at UOB — pre- and post-shipment financing for project working capital, secured against Rp50bn of receivables — undrawn at year-end [21]. It arrives just as the hardware supply chain tightens around a few names: payables to PT ECS Indo Jaya, the largest distributor, more than doubled to Rp153.8bn from Rp70.4bn within a Rp733bn third-party payables book [22]. Putting a bank line behind supplier payments as concentration rises is prudent plumbing, and a marker to watch: if that line starts to draw, it is the first place the working-capital strain flagged in the receivables build (Cash Conversion) would surface.
The hygiene is clean, with one covenant footnote
For a skeptic looking for a hidden liability, the contingent picture is reassuring. Through 2025 the company reported no material or significant legal matters and no material administrative sanctions from capital-market or government authorities [23]. Every facility notes full covenant compliance, and the audited statements are delivered to the lenders within 180 days by a bank-approved auditor [24]. The contingent exposures here are facility-based, not disputes.
One nuance is worth recording against the earlier read that no covenant restricts distributions. The UOB agreement requires the company to give the bank prior written notice before distributing dividends during the loan term, and before taking on any new facility above Rp5bn [25]. A notification covenant is not a block — it did not stop the Rp122/share FY2025 dividend or the maiden interim (What to Watch) — but it is a lender touchpoint on capital returns that did not exist before this line was signed, and one more reason the family's cash-return latitude is not quite unconstrained.
What this changes about the margin-of-safety read
On the balance-sheet leg of the margin-of-safety question, the evidence points to a fortress that is real but modestly overstated by the headline. The Rp1.6T of net cash is genuine and cheaply held; the business is not levered and pays almost nothing in interest. Against that, some of the cash is pledged and grows with the guarantee book, essentially all operating assets secure the facilities, and a new lender now has a notice right over dividends. The strongest fact on the other side is that the lines sit undrawn — the company demonstrably does not need them to fund itself, which is exactly what you want to see. What would move the read is a change in that behaviour: a sustained draw on the BCA revolver or the UOB supplier line, a step-up in restricted cash, or a guarantee call — any of which would signal that the working-capital cushion earlier chapters credited had started to thin.
Control and Capital
Three co-founders own about 85% of MSTI and take their return the way a minority holder does — through a pro-rata cash dividend, not through salary or related-party dealing. Key-management pay is flat at roughly Rp49bn (about 9% of profit, and edging down), and no material related-party transactions ran through FY2025. The case is most sensitive to capital allocation: roughly Rp1.6T of net cash earns about 2%, masking a return on the operating business near 76% behind a 24% consolidated headline.
For a reader who prizes founder skin-in-the-game and a near-zero chance of failure, MSTI's ownership answers most of the alignment question cleanly. What it does not settle is whether holding a cash pile worth close to 38% of the company's market value is the best use of that capital for the 15% who ride alongside the founders — the balance sheet that makes the case is also the balance sheet that dilutes the reported return.
Who owns the company
The register is unusually concentrated and unusually simple. At 31 December 2025, three individuals who founded the company in 1994 held 84.98% of the shares between them, and the public float was exactly 15% [1]. One of the three, Jupri Wijaya, sits on the Board of Commissioners rather than the Board of Directors, so the control block spans both tiers of the governance structure [2].
Source: FY2025 Annual Report, Note 16 Share Capital (register as at 31 Dec 2025) [3].
Two features follow from that structure. The founders hold 2.67 billion shares — worth roughly Rp3.6T at the recent price — the same shares a new buyer would own, which is the alignment a skin-in-the-game investor looks for. The mirror image is liquidity and voice: with only 15% of the stock in public hands, minority holders are passengers. They cannot block a resolution, and day-to-day trading is thin. The concentration that supplies the alignment also removes the market's usual check on a controlling family.
How the founders are paid
The more telling alignment signal is how the founders extract cash, because a controlling owner has several ways to do it and only some of them treat minorities equally. MSTI's founders are paid overwhelmingly through the dividend every shareholder receives, not through the two channels that would disadvantage the 15%.
Aggregate remuneration for all six directors and three commissioners combined was Rp49.4bn in FY2025 — essentially unchanged from FY2024 and about 9.0% of net profit, a share that has drifted down from 9.8% in FY2023 even as profit rose [4]. Pay did not rise when growth stalled in FY2025, and it is spread across nine people. Indonesian issuers disclose only this combined figure, so a per-officer split is not available; but the aggregate is modest against a Rp549bn profit and a Rp2.3T equity base.
Source: FY2025 Annual Report, remuneration disclosure and financial-statement notes; FY2022–FY2023 from the FY2023 Annual Report [5] [6].
Against that Rp49bn of pay sits the dividend. The FY2024 cash dividend was Rp118 per share, or Rp370.5bn in total, paid in June 2025 — roughly 70% of that year's profit; a Rp16-per-share interim dividend (Rp50.2bn) followed in December 2025, and the FY2023 dividend had been Rp99.84 per share [7]. On their 85% stake the founders collected about Rp315bn of the FY2024 dividend — more than six times their combined salary. Because that money reaches them at exactly Rp118 per share, the same rate paid to every outside holder, the dominant way the family monetises the business is one that cannot shortchange minorities.
Source: FY2025 Annual Report, Dividend Policy; payout computed against reported net profit [8].
The third channel — self-dealing through related-party contracts — is where founder-controlled companies most often leak value, and here the record is clean. The only related-party trade balance on the books is a Rp406m receivable from a joint venture, and management states there were no material transactions involving conflicts of interest or related parties during 2025 [9]. The founders do not appear to rent property to the company, sell it supplies, or route revenue through affiliates they own. Taken together — flat modest pay, a pro-rata dividend, no material related-party dealing — the alignment leg of the through-line holds up well.
The cash pile and the return it hides
Capital allocation is where the alignment story meets its most legitimate challenge. MSTI ended FY2025 with Rp1,627bn of cash against Rp17.6bn of bank debt, so net cash was about Rp1,610bn — close to 38% of the company's market value [10]. That hoard is the ballast a failure-averse investor wants. It is also lazy capital: it generated Rp29.7bn of interest income in FY2025 — a gross yield near 2% — even after that income jumped 52% as the pile and deposit rates rose [11].
The cost of carrying it shows up in the headline return. MSTI reports roughly 24% return on its Rp2.29T of equity. But close to Rp1.6T of that equity is net cash earning 2%. Strip it out, and the operating business — which earned Rp664bn of operating profit, or about Rp519bn after tax, on the roughly Rp0.68T of equity that is actually deployed — is generating a return on capital in the region of 76%.
Source: derived from FY2025 reported operating profit, tax, equity and net cash [12].
That gap frames the decision the founders face. The underlying business is extraordinarily capital-light and high-returning; the consolidated 24% understates it by roughly three times because the balance sheet carries a decade's worth of retained profit in cash. Returning more of that cash — a larger dividend or a buyback — would lift per-share returns; a buyback would also be accretive at an EV under five times earnings. The practical obstacle is the 15% float: buying back a meaningful amount of stock would quickly exhaust it and risk breaching listing free-float rules, so the dividend is the realistic lever, and the founders have been pulling it — the payout has held near 70% and they added an interim dividend in December 2025.
The reason this reads as a considered choice rather than neglect is the ownership itself: the founders own 85%, so they absorb 85% of the return drag the cash creates and would capture 85% of any distribution that fixed it. They are not hoarding at minorities' expense — they are hoarding at their own. For an investor who wants bankruptcy risk near zero, that conservatism is a feature; for one indifferent to it, the return is most sensitive to how that ~Rp1.6T is deployed, and the main risk to that read is simply that the family prefers the safety and keeps building the pile.
Guardrails, dilution, and the minority's seat
The formal governance around the control block is adequate but light. MSTI runs the standard Indonesian two-tier structure: a six-member Board of Directors, all founders or long-tenured insiders with no independent director, overseen by a three-member Board of Commissioners of which one — Tang Budi Santoso Sutanto — is independent and chairs both the Audit and the Nomination & Remuneration Committees [13]. The chair (President Commissioner) and CEO (President Director) are different people, but both are co-founders, so the separation is nominal. A single independent voice is the minimum the rules require, not a robust check.
One latent dilution deserves flagging and then right-sizing. The 2023 general meeting authorised a management stock-option programme (MESOP) of up to 80,040,000 new shares — 3% of capital [14]. The authorisation is real, but usage has been trivial: the first and only exercise window, in late 2024, issued just 592,600 shares — under 0.02% of the company — taking the count to today's 3,139,416,200 [15]. Dilution is a risk to monitor if future windows open at scale, not a present drag.
What the structure leaves open is the classic minority exposure in a founder-controlled company: the same 85% that aligns today could, tomorrow, approve a dilutive issuance, change the dividend policy while cash keeps building, or take the company private at a price the float cannot contest. None of these has happened, and the dividend record argues against them. But they are the events that would flip the ownership from a margin-of-safety asset into a liability, and they are what a holder of the 15% should watch: a cut in the payout ratio, a jump in MESOP issuance, or any move to buy out the float.
Moat and Market
Indonesia's IT market is not the ceiling. National ICT spend runs to roughly USD46.6 billion, and the cloud, data-centre and cybersecurity sub-markets MSTI serves are compounding at double digits [1]. So the FY2025 revenue pause is not a market that stopped growing. What MSTI owns inside that market is narrower: a 6.9% share as the country's third-largest IT solutions provider, top-tier Cisco status, and three decades of banking relationships — real advantages, but ones the company earns each year in a business its own filings call low-barrier and fragmented [2].
The market is still growing
The demand backdrop is the strongest part of the case. Indonesia's ICT market is put at USD46.57 billion for 2025, with large enterprises holding 71.8% of it and the banking, financial-services and insurance sector — MSTI's core vertical — accounting for 24.5% of ICT consumption; cloud computing is the single largest technology slice at 39% [3]. The information-and-communication sub-sector grew 9.65% in the third quarter of 2025 [4].
ICT Market (USD B)
Cloud (USD B)
Data Centre (USD B)
Cybersecurity (USD B)
Sources: Indonesian ICT market size USD46.57B and cloud 39% share, FY2025 Annual Report [5]; cloud USD2.46B and data-centre USD1.61B [6]; cybersecurity USD1.35B a Mordor estimate; all 2025, as reported by Mordor Intelligence.
The data-centre market is sized at USD1.61 billion for 2025 (1.44 gigawatts of IT capacity) and cloud computing at USD2.46 billion [7]. The sharpest growth is in security: management cites a cybersecurity market rising from USD1.62 billion in 2026 to USD4.06 billion in 2031, a 13.71% CAGR [8], pulled along by the new Personal Data Protection Law and a documented 94 million data-breach victims in 2024 [9].
Source: Indonesian cybersecurity market, USD1.62B (2026) to USD4.06B (2031), 13.71% CAGR, per Mordor Intelligence as cited in the FY2025 Annual Report [10]; the 2025 figure is a Mordor Intelligence estimate.
Set against these growth rates, MSTI's +1.7% FY2025 and the single-digit FY2026 outlook laid out in Financials and Estimates put the company below its own end-markets. That gap — growing slower than the tailwind — is the real subject of this chapter: it is a competitive-position question, not a market-death question.
Where MSTI sits
MSTI is a genuine scale player, not a fringe reseller. A Euromonitor study cited in its IPO-era reporting ranked it the third-largest IT solutions provider in Indonesia by 2022 revenue, with a 6.9% market share [11]. Over 30 years it has assembled more than 40 principal partners and served over 1,000 customer entities across telco, financial services, oil and gas and the public sector [12].
Market Share (%)
Principal Partners
Customer Entities
Years Operating
Sources: 6.9% share / third-largest ranking per Euromonitor, FY2023 Annual Report [13]; 40+ principals, 1,000+ customers, 30 years per FY2025 Annual Report [14]. Values shown as disclosed minimums ("more than").
The clearest evidence of a durable advantage is MSTI's standing with Cisco, which has been its anchor principal since 2003 [15]. It was named ASEAN Cisco Partner of the Year for four consecutive years (2020–2023) and Cisco's Worldwide Service Provider Partner of the Year for Mass Scale Infrastructure in 2022 [16], and it added a Cisco APJC Winners Circle award for Secure Networking Excellence in 2025 [17]. In management's own words, this "key partner" status delivers more competitive pricing and joint marketing support — the commercial core of whatever moat exists [18].
The moat, in numbers
A moat should show up in returns, margins or pricing power. MSTI's returns are strong and steady — a ~24% consolidated ROE, examined in Control and Capital — but its margins tell the more sober story. FY2025 gross profit was Rp984.0 billion on Rp5.45 trillion of sales, an 18.0% gross margin that has drifted down from 20.8% in FY2023 and barely moved (+2.0%) even as the sales mix shifted [19]. That is reseller-integrator economics, not proprietary-software economics.
The point sharpens against peers. The closest pure comparison is Multipolar Technology (MLPT), a bank-focused integrator: on FY2025 revenue of about Rp3.84 trillion it earned a 16.4% gross margin and an 8.8% net margin — within a point of MSTI's profile — and its net income actually fell about 15% that year (per MLPT's published FY2025 results). Metrodata (MTDL), the largest listed name, ran roughly Rp27.2 trillion of revenue at a ~3.0% net margin, its distribution weighting pulling margins well below MSTI's (per MTDL's FY2025 results). The one indexed peer with a genuinely different economic model, data-centre operator Indointernet (EDGE), earned a 47.6% gross margin — but on a capital-heavy, leveraged base that produced just a 6.6% ROE and a 17% revenue decline in FY2025 [20].
Sources: MSTI FY2025 gross profit and margins [21] and ~24% ROE (see Control and Capital); EDGE FY2025 revenue, margins and ROE [22]; MLPT and MTDL from their published FY2025 results (web). MTDL ROE not shown; distribution-weighted model.
Two readings follow. First, MSTI's profitability is typical of a well-run Indonesian integrator, not a signature of a unique moat — MLPT reaches nearly the same margins. Second, MSTI's edge over that peer set is not margin but balance sheet and consistency: it carries roughly Rp1.6 trillion of net cash (see Cash Conversion) and has held a ~24% ROE for five years, while MLPT's higher headline ROE (~47%) simply reflects a leaner-capitalised business, and EDGE's model trades margin for capital intensity and leverage.
What management concedes
The candid part of the FY2025 report is its risk register, which names the very things that keep this from being a wide moat. Management states plainly that the IT system-integration industry in Indonesia is "highly fragmented, with low barriers to entry," attracting a growing number of competitors [23]. It also confirms it holds no exclusive agreements: its principals are free to appoint any other Indonesian IT company, so the Cisco relationship is a status to be re-won annually through engineer certifications and sales volume, not a contract that locks rivals out [24].
That dependence is visible in the supply chain. In FY2025, two suppliers each exceeded 10% of net sales — PT ECS Indo Jaya at Rp902.3 billion and Cisco International at Rp601.3 billion, together about 28% of revenue passing through two vendors [25]. Cisco has been a greater-than-10% supplier every year in the record; as recently as FY2023 it alone represented Rp1.27 trillion of purchases, about 36% of that year's net sales [26].
Source: purchases exceeding 10% of net sales, FY2023–FY2025. FY2025 and FY2024 (ECS Indo Jaya and Cisco) [27] and FY2024 detail [28]; FY2023 (Cisco only above 10%) [29]. ECS Indo Jaya is itself a multi-brand distributor, so true Cisco exposure is understated by the direct line.
The migration from buying Cisco directly (FY2023) toward buying through the ECS Indo Jaya distributor (FY2025) diversifies the invoice, not the underlying reliance — much of the ECS volume is itself principal product. The same page also records the customer-side concentration examined earlier: Bank Indonesia alone was 12.3% of FY2025 sales (Rp669.5 billion) [30]. A narrow supplier base and a rotating, concentrated customer base sit on either side of the integrator's thin margin.
The stall in competitive context
The competitive frame reshapes the FY2025 stall. MSTI did not slow while rivals sprinted: Multipolar's net income fell about 15% in the same year, and even Metrodata's higher-margin solutions arm grew sales only ~4.5% (per each company's FY2025 results), with the group's double-digit print carried by lower-margin hardware distribution and smartphones. A project-driven, hardware-refresh business — replacements typically run on a three-year cycle [31] — is lumpy across the whole peer group, which tilts the evidence toward a shared cyclical pause rather than a MSTI-specific ceiling.
MSTI's answer to the low-barrier problem is to climb off pure resale. It has begun building intellectual property on top of principal solutions — the Mastersystem Secure Sphere (MS3) cybersecurity suite and a partnership with NVIDIA for AI infrastructure [32] — and in 2025 launched the AmanTerus consumer-security app and earned an AWS Managed Service Provider certification [33]. These push toward stickier, recurring managed-services revenue, which management frames as the strategic centre of gravity for 2026 [34]. But they remain small relative to a Rp5.45 trillion book still ~50% hardware, and none yet shows up as a rising blended margin.
The read
The evidence points to a narrow, execution-based advantage rather than a structural moat. MSTI's returns are real and repeatable, its Cisco standing and banking entrenchment are hard for a start-up to replicate quickly, and its balance sheet lets it outlast a downturn that would strain a leveraged rival. But the advantage is continually contested in a market management itself calls low-barrier and fragmented, it rests on non-exclusive vendor relationships and a supplier base ~28% concentrated in two names, and its 18% gross margin is the market's economics, not evidence of pricing power.
The strongest fact against a bearish reading is the market itself: a mid-single-digit grower priced under five times earnings, sitting inside cloud, data-centre and cybersecurity sub-markets compounding at double digits, has a long runway if it merely holds share [35]. What would change the read in either direction is measurable and worth watching: a blended gross margin that turns up as managed services and IP scale would signal the moat is widening; a further slide in gross margin, a loss of top-tier Cisco status, or share ceded to MLPT and MTDL would confirm a commoditising integrator growing below its own market.
What the Price Implies
At Rp1,350, MSTI trades at 7.7x trailing earnings — but strip out the Rp1.5 trillion of net cash that is roughly 36% of its market value and the market is paying about 5x earnings for the operating business itself. That price discounts the bear case built through the prior chapters: a mid-single-digit-growth reseller with a narrow moat and idle cash. The cheapness is real, but the founding family controls ~85% of the shares, so whether a minority holder ever captures it depends on decisions only the family can make.
Share Price (Rp)
Market Cap (Rp bn)
Net Cash (Rp bn)
Trailing P/E
EV / Earnings
Dividend Yield
Sources: share price Rp1,350 at 22 Jul 2026 (as reported); market cap = 3,139,416,200 shares [1] × Rp1,350; net cash Rp1,627,326m cash [2] less Rp99,515m total borrowings [3]; earnings FY2025 net income Rp549,081m [4].
The cash makes the headline multiple misleading
The 7.7x trailing P/E understates how cheaply the market prices what MSTI actually does. FY2025 net income was Rp549.1 billion [5] on operating profit of Rp664.1 billion [6]; against a Rp4,238 billion market cap that is 7.7x earnings and 6.4x operating profit. But the company ended 2025 with Rp1,627.3 billion of cash [7] against only Rp99.5 billion of total borrowings including lease liabilities [8] — net cash of about Rp1.53 trillion (Rp1.61 trillion excluding leases, the basis used in Cash Conversion). That pile is roughly 36% of the market cap, or about Rp487 per share.
Netting it out, enterprise value is about Rp2.71 trillion. After crediting ~Rp1.5T of net cash (about 36% of market value), MSTI's operating business trades at only ~4.9x FY2025 earnings and ~4.1x operating profit — but that trailing base is already contracting, with Q1 FY2026 net sales down 8.0% to Rp1,096.0bn and net profit down 7.5% to Rp106.6bn. A cleaner way to see it: hand the reader the cash at face value, and the residual price for the operating business is what remains.
Source: derived from FY2025 reported financials — net cash Rp1.53tn ÷ 3.139bn shares = Rp487/share [9]; operating EPS strips out the after-tax portion of Rp29.65bn interest income from Rp174.9 reported EPS [10].
So at Rp1,350 the market values MSTI's core system-integration business at roughly 5x earnings while assigning its cash pile face value. That is a demanding read only if the operating business is worth more than 5x — a business that grew revenue +1.7% in FY2025 [11] and earns an ~18% gross margin no better than peers (Moat and Market). The multiple prices in the reset, not a recovery.
Triangulating against the peers
Three lenses, three answers that broadly agree. On trailing P/E, MSTI's 7.7x sits right on top of Metrodata (MTDL), the largest listed Indonesian IT name, at about 7.7x. On enterprise value MSTI looks cheaper than the headline because so much of its market cap is cash — EV/earnings of ~4.9x against MTDL's ~6.4x EV/EBITDA. And on income, MSTI's 8.7% dividend yield is close to double MTDL's ~4.6%. The one pure-play system-integrator peer, Multipolar (MLPT), is a poor valuation anchor: it carries a reported P/E well above 50x on a thin, controlled float and a dividend yield under 0.5%, so its multiple says more about float scarcity than about what an SI is worth.
Sources: MSTI trailing P/E and EV/earnings derived from FY2025 financials [12]; dividend Rp118/share ÷ Rp1,350 [13]; peer P/E, EV/EBITDA and dividend yields for MTDL and MLPT per current market data (stockanalysis.com / Simply Wall St, as reported).
The peer read cuts both ways. It says MSTI is not obviously mispriced against MTDL on earnings — both trade near 7.7x — but that MSTI carries a materially fatter cash cushion and pays out roughly twice the income. MLPT's ~47% ROE on near-identical ~16% gross margins, noted in Moat and Market, is the reminder that MSTI's own ~24% ROE is depressed by that same idle cash, not evidence of a superior franchise. The market appears to be splitting the difference: crediting the balance sheet with a floor, discounting the operating business for slow growth.
What a range of assumptions implies
A sum-of-the-parts frame shows the answer is most sensitive to the multiple the market assigns the operating business. Credit net cash at ~Rp487 per share and value the ~Rp526 billion of operating earnings across a plausible band — 5x (the current implied level), 7x (in line with MTDL), 9x (a re-rating toward the double-digit end-markets management points to).
Source: derived from FY2025 reported financials — net cash Rp487/share plus operating net income ~Rp526bn valued at 5x/7x/9x ÷ 3.139bn shares [14].
The band runs from about Rp1,325 (business at 5x) to about Rp1,995 (business at 9x). The current Rp1,350 sits at the bottom of that range — the market is paying essentially the bear case. The three-analyst consensus target of Rp1,767 (a "Strong Buy", range Rp1,600–2,000, per current sell-side estimates) sits near the middle — but note what it assumes: on FY2026 consensus EPS of Rp183, Rp1,767 is 9.6x forward earnings, up from 7.4x today, against EPS growth of only ~5%. The upside the sell-side models is almost entirely a re-rating, not reacceleration. The assumption the whole range is most sensitive to is therefore not next year's earnings — those move little in any case — but whether the market ever assigns the operating business a multiple above the ~5x it pays today, and whether the cash is credited to a minority at all.
The tension, stated as shared facts
The bull and bear here are not arguing about different numbers; they read the same facts in opposite directions. Each row below is a filing item, not a vibe, with the evidence that would settle it.
Sources: net cash and ROE bridge [15]; FY2025 revenue growth and operating result [16]; dividend and payout [17]; ownership and share count [18].
A measured read
The evidence points one way on the arithmetic and hedges on the outcome. On the numbers, MSTI is cheap: about 5x earnings for the operating business, a Rp1.5 trillion net-cash floor equal to roughly 36% of the market value [19], and an 8.7% dividend paid out of that cash, not borrowed [20]. A holder is paid a high single-digit yield to wait, with a balance sheet that makes permanent loss unlikely.
The strongest fact against that read is that none of the cheapness converts to a minority return on its own. The family owns ~85% and the board carries no independent director, so the two levers that would close the gap — distributing or deploying the Rp1.5 trillion, or reaccelerating growth — are theirs alone to pull, and the low multiple is partly earned by a genuine reset: FY2024's +27.6% leaned on a non-recurring project (Financials and Estimates), and management now guides single-digit growth. What would change the read is concrete and checkable: a capital-return step-up (a larger or repeated interim dividend, a buyout of the float) or a return to double-digit revenue would validate the bull; a second flat year with the cash still idle would confirm that the ~5x is the business, not a discount. This is a value-and-yield holding whose upside is gated on a capital-allocation or growth catalyst the minority cannot compel. The margin of safety is in hand; the catalyst is not.
What to Watch
This chapter converts the case built across the report into a dated watch list. The largest catalyst earlier chapters flagged as pending — the FY2025 dividend — has now resolved: shareholders approved Rp122 per share, a 70% payout held flat, with a first-ever interim introduced but no step-up beyond the self-imposed 70% ceiling. The next hard event is the 29 July 2026 half-year print. Most of what would move the read — recurring-revenue mix, blended gross margin, the payout ceiling, and cash deployment — is slow-moving and family-controlled, and earnings reactions over the past year have skewed negative.
The dividend question, resolved
The Control and Capital and What the Price Implies chapters flagged the FY2025 dividend as a direct test of whether the family shares the cash with minorities. It has now been decided. At the 26 May 2026 AGM shareholders approved a Rp106 final dividend for FY2025; added to the Rp16 interim paid on 29 December 2025 [1], that is Rp122 per share, or about Rp383 billion — 70% of FY2025 net profit of Rp549 billion, per company announcements.
FY2025 Dividend/Share (Rp)
Payout Ratio
Trailing Yield at Rp1,350
First Interim (Rp/Share)
Source: interim and prior-year dividends from FY2025 Annual Report [2]; FY2025 final dividend and total per the May 2026 AGM (company announcements); payout and yield derived from reported financials.
The signal is mildly constructive, and bounded. Constructive: the dividend per share rose for a third straight year (Rp99.84 in FY2023, Rp118 in FY2024, Rp122 in FY2025), the payout has settled at 70%, and management used its articles to pay a maiden interim — a small structural upgrade to the cash-return cadence. Bounded: 70% is not a surprise but the explicit ceiling. Company policy states the Board may propose a cash dividend of at most 70% of net profit [3], so the FY2025 decision delivered the top of the stated range rather than a break above it. The deeper lever — deploying the roughly Rp1.6 trillion of idle net cash isolated in Cash Conversion — remains untouched: financing outflows rose only because dividends rose [4], not because any buyback or special distribution occurred.
Source: FY2025 Annual Report, Dividend Policy [5]; FY2025 final per the May 2026 AGM (company announcements).
Two features are worth carrying into the watch list. First, the articles permit interim dividends and impose no negative covenant restricting distributions [6], so a second interim in December 2026 or a payout above 70% is mechanically available if the family chooses it. Second, at Rp1,350 the Rp122 already declared is a 9.0% trailing yield, and 70% of FY2026 consensus EPS of Rp183 would be roughly Rp128 — a forward yield near 9.5%. The cash return is real; whether it steps up further, or the idle balance is put to work, remains to be seen.
The near-term print
The next scheduled event is the half-year FY2026 result, expected 29 July 2026 per consensus data. It is the only dated hard catalyst in the near term, and it lands one week from this writing. Consensus (three analysts) models FY2026 revenue of about Rp5.70 trillion — roughly 4.5% growth on FY2025's Rp5.45 trillion — and EPS of Rp183, with a mean target of Rp1,767 against the Rp1,350 price. The print matters less for the headline than for three lines beneath it: whether hardware has stabilised after its FY2025 decline, whether the software/services mix keeps rising, and whether blended gross margin turns up from the 18.0% it reached in FY2025.
The base rate argues for muted expectations. Over the four quarterly windows visible in the past year of price history, the reaction has been negative three times, and flat once.
Source: derived from daily price data (company filings, as reported); results windows approximate — only one year of listed price history is available, so this rests on four observations.
The worst reaction, roughly -7% over the sessions around the late-October 2025 print, coincided with the quarter that made the growth stall visible; the FY2025 full-year and Q1 FY2026 prints each shed about 3%. Two caveats temper any base rate. The sample is four points — the price feed begins in July 2025 even though the stock listed in November 2023 — and the moves are small in absolute terms because the stock is thinly traded: 20-day average value is about Rp1.2 billion a day, roughly US$70,000, so a single institutional order can move it and a genuine surprise would clear the noise easily. The asymmetry to hold in mind is that expectations are already low (Strong Buy on a 7.7x multiple), so an in-line single-digit print is largely discounted, while a return toward double-digit growth or a margin turn would be the informative surprise.
The watch list
The items below are ordered by decision value. Each names the line to monitor, the filing it appears in, the threshold that would change the read, and the next data point that tests it. Whether the business is merely cyclical or has reached a structural ceiling resolves through the mix and margin items, not through any single quarter.
Sources: FY2025 Annual Report — Business Outlook [7], Board of Directors' Report [8], Highlighted Events [9], and Dividend Policy [10]; H1 window and consensus per estimates data.
The recurring-revenue mix and gross-margin items carry the most decision weight. Management has committed in writing to transforming the model "from one-time transactions to recurring business" through managed services [11], and frames 2026 around cybersecurity, cloud and managed services — pointing to the Indonesian cybersecurity-market forecast set out in Moat and Market [12]. That is the stated path to a wider moat and a higher operating multiple. The test is arithmetic, not narrative: recurring revenue rising as a share of sales with blended gross margin turning up. As Moat and Market established, the mix shift into software has so far been low-margin licence resale, so a rising software share alone does not confirm the pivot — the margin has to move with it.
The supplier-badge item runs the other way. MSTI was named Cisco APJC Commercial Partner of the Year in November 2025, for the second consecutive year [13]. Retaining that status is confirmation the core reseller franchise is intact; losing it would be an early warning on the very asset the low multiple is anchored to. It is a slow, annual signal — but a clean, checkable one.
The dividend and cash-use item is where the family holds the pen. With the articles permitting interims and no covenant blocking distributions [14], a December 2026 interim or a move above 70% at the May 2027 AGM would be the clearest evidence the controlling owners intend to close the price-to-value gap rather than let cash compound at roughly 2%. FY2025 answered the question one notch in the bull's favour — payout held at the ceiling, interim introduced — without settling it.